helps to estimate which color is the background color of your plot
Usage
estimateImageBg(mg_object, top_color_range = seq_len(50))Examples
g <- GiottoData::loadGiottoMini("visium")
#> 1. read Giotto object
#> 2. read Giotto feature information
#> 3. read Giotto spatial information
#> 3.1 read Giotto spatial shape information
#> 3.2 read Giotto spatial centroid information
#> 3.3 read Giotto spatial overlap information
#> 4. read Giotto image information
#> python already initialized in this session
#> active environment : 'giotto_env'
#> python version : 3.10
g_image <- getGiottoImage(g, name = "image")
mgimg <- as(g_image, "giottoImage")
estimateImageBg(mgimg)
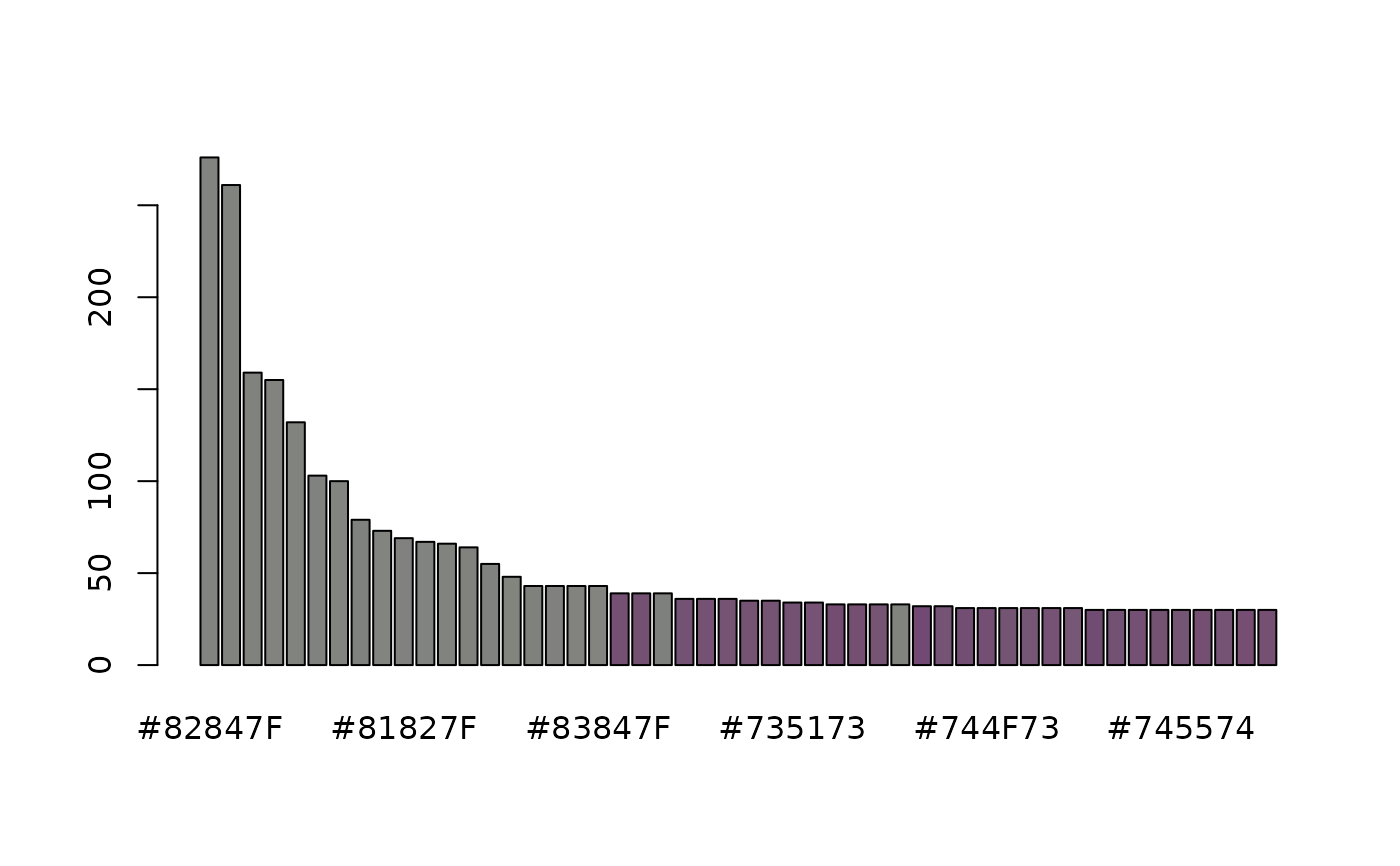 #> Most abundant pixel colors:
#> 276 261 159 155 132 103 100 79 73 69 67 66 64 55 48 43 43 43 43 39 39 39 36 36
#> 36 35 35 34 34 33 33 33 33 32 32 31 31 31 31 31 31 30 30 30 30 30 30 30 30 30
#> Most abundant pixel colors:
#> 276 261 159 155 132 103 100 79 73 69 67 66 64 55 48 43 43 43 43 39 39 39 36 36
#> 36 35 35 34 34 33 33 33 33 32 32 31 31 31 31 31 31 30 30 30 30 30 30 30 30 30