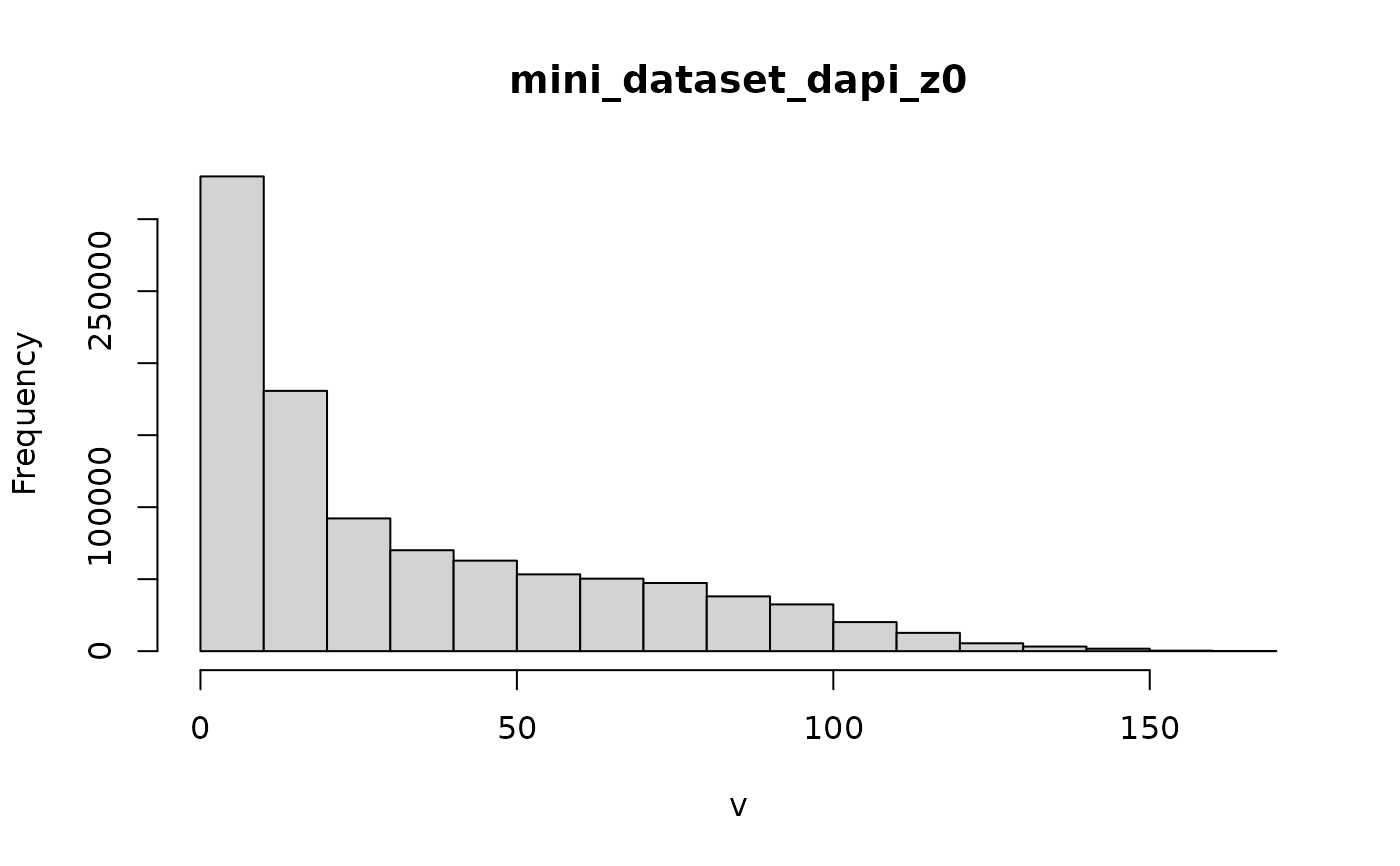
Create a histogram of the pixel values of a giottoLargeImage. Wrapper around
terra::hist()
Arguments
- x
giottoLargeImage
- show_max
logical. Plot the set max intensity as a vertical red line
- ...
Arguments passed on to
terra::hist
Examples
f <- system.file(package = "GiottoClass", "extdata/toy_intensity.tif")
gimg <- createGiottoLargeImage(f, use_rast_ext = TRUE, verbose = FALSE)

hist(gimg)
#> Warning: [hist] a sample of 83% of the cells was used