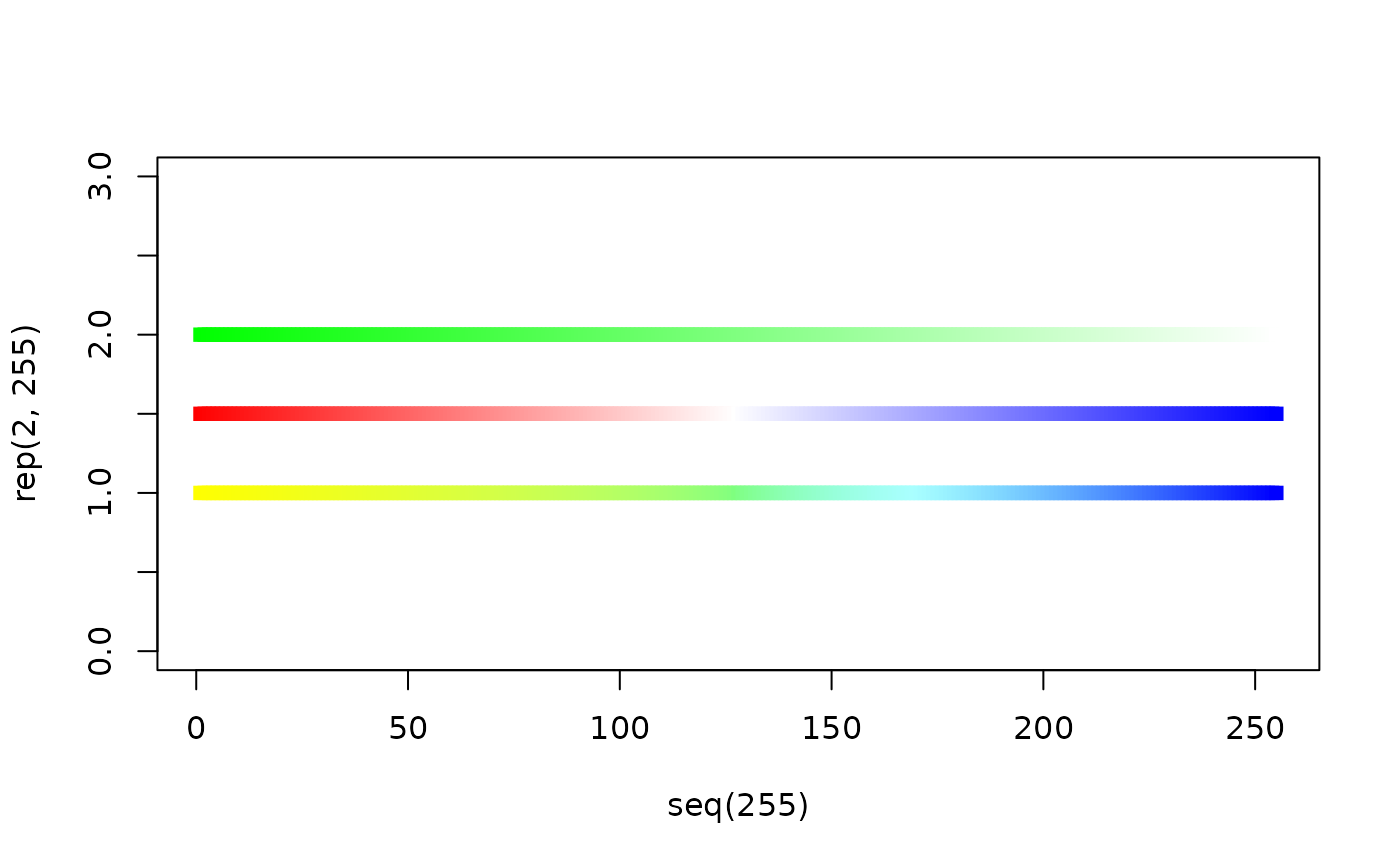
Vectorized approximation of additive-type color mixing using the HSV
colorspace.
Intended for helping in plotting more than one variable at the same time and
showing how they overlap.
Since the mixing is performed using HSV, this function interpolates hue
mixtures, however due to the orthogonal nature of HSV, it does not imitate
the ability to generate white from red, green, and blue which the RGB
colorspace would be better at. However, this limitation is fine for this
use case which prioritizes clearly understandable mixtures of 2 or more
colors. Additionally, the orthogonal nature of saturation and value to hue
allows either of them to be treated as the absence of signal or alpha when
mixing to match with plotting backgrounds.
Treating either white or black as the base color makes it so that either
saturation or black, respectively, are treated as alpha, applying a weighting
to c1 or c2 values during mixing.
See also
Other colormixing functions:
mixRGB()
Examples
# with black background
a <- GiottoVisuals::simple_palette_factory(c("green", "black"))(255)
b <- GiottoVisuals::simple_palette_factory(c("red", "black", "blue"))(255)
x <- mixHSV(a, b, base_color = "black")

op <- par(no.readonly = TRUE)
par(bg = "black")

# plot input color vectors
plot(seq(255),
    y = rep(2, 255), col = a, pch = 15, ylim = c(0, 3),
    bg = "black"
)
points(seq(255), y = rep(1.5, 255), col = b, pch = 15)
# plot mixture
points(seq(255), y = rep(1, 255), col = x, pch = 15)


par(op)

# with white background
a <- GiottoVisuals::simple_palette_factory(c("green", "white"))(255)
b <- GiottoVisuals::simple_palette_factory(c("red", "white", "blue"))(255)
x <- mixHSV(a, b, base_color = "white")

plot(seq(255),
    y = rep(2, 255), col = a, pch = 15, ylim = c(0, 3),
    bg = "black"
)
points(seq(255), y = rep(1.5, 255), col = b, pch = 15)
points(seq(255), y = rep(1, 255), col = x, pch = 15)

