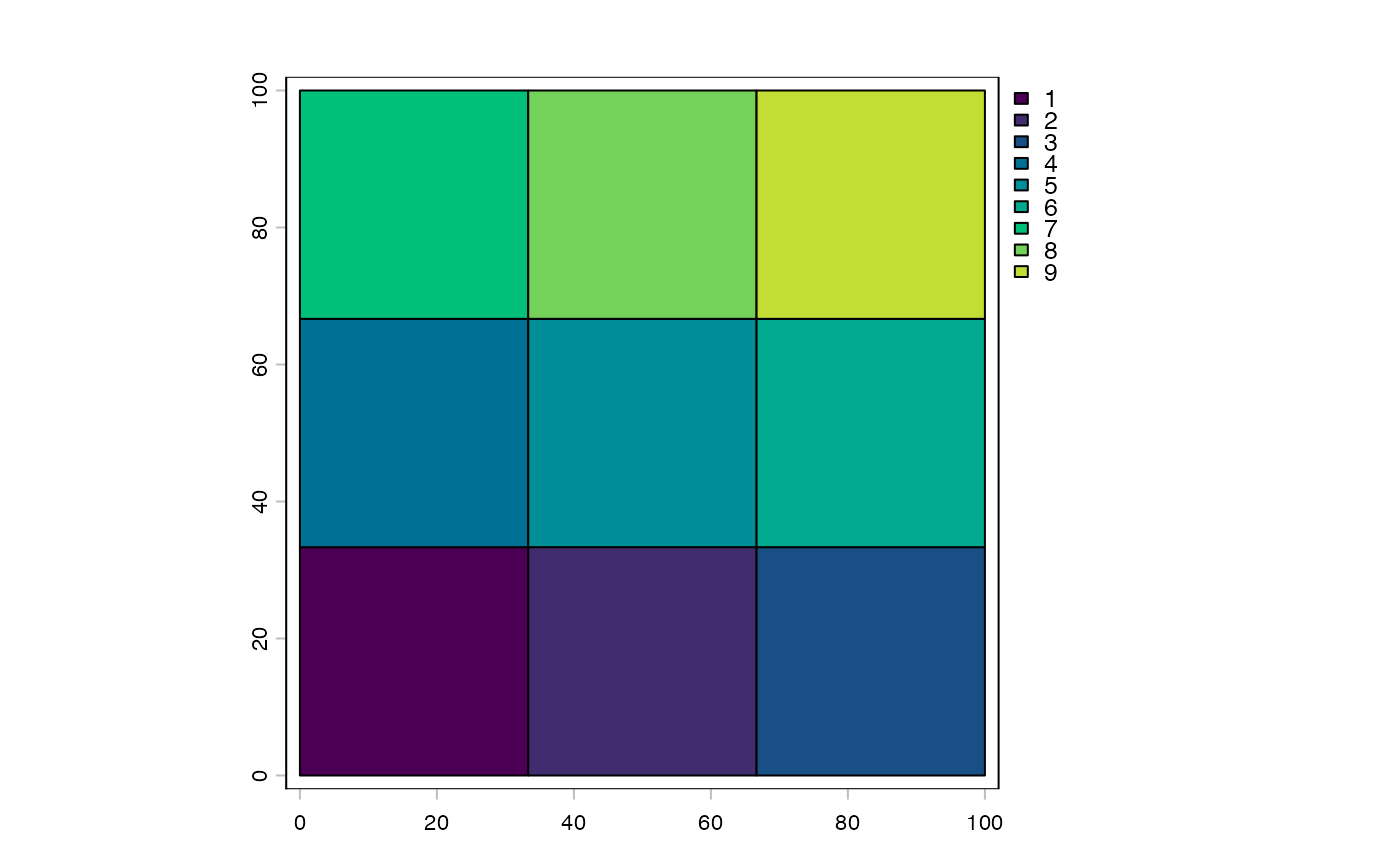
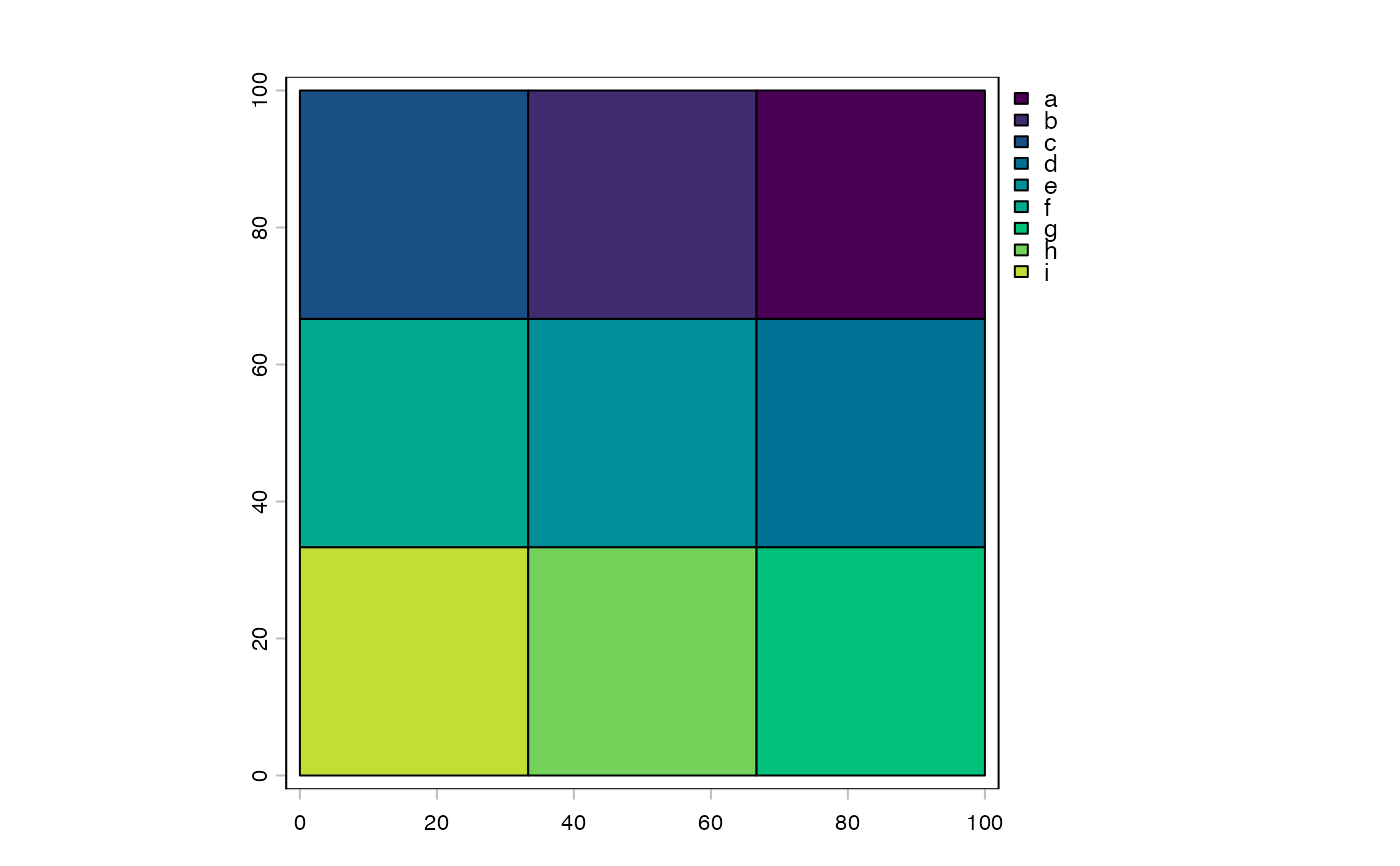
Plot and preview the tile plan. This is likely to be very slow if there are a lot of tiles (in the neighborhood of >10,000)
Usage
# S4 method for class 'tilePlan,missing'
plot(x, values = "tile", color_as_factor = FALSE, ...)

# S4 method for class 'freeTilePlan,missing'
plot(x, y, ...)

# S4 method for class 'pointTilePlan,missing'
plot(x, y, ...)

# S4 method for class 'pixelTilePlan,missing'
plot(x, y, ...)See also
Other tile* methods:
arith,
as.polygons(),
bracket,
centroids(),
dim(),
dollar,
double_bracket,
ext(),
intersect()