Visualize cells according to spatial coordinates
Usage
spatPlot2D(
  gobject,
  spat_unit = NULL,
  feat_type = NULL,
  plot_method = "ggplot",
  show_image = FALSE,
  gimage = NULL,
  image_name = NULL,
  largeImage_name = NULL,
  group_by = NULL,
  group_by_subset = NULL,
  spat_loc_name = NULL,
  sdimx = "sdimx",
  sdimy = "sdimy",
  spat_enr_names = NULL,
  cell_color = NULL,
  color_as_factor = TRUE,
  cell_color_code = NULL,
  cell_color_gradient = NULL,
  gradient_midpoint = NULL,
  gradient_style = c("divergent", "sequential"),
  gradient_limits = NULL,
  select_cell_groups = NULL,
  select_cells = NULL,
  point_shape = c("border", "no_border", "voronoi"),
  point_size = 3,
  point_alpha = 1,
  point_border_col = "black",
  point_border_stroke = 0.1,
  show_cluster_center = FALSE,
  show_center_label = FALSE,
  center_point_size = 4,
  center_point_border_col = "black",
  center_point_border_stroke = 0.1,
  label_size = 4,
  label_fontface = "bold",
  show_network = FALSE,
  spatial_network_name = "Delaunay_network",
  network_color = NULL,
  network_alpha = 1,
  show_grid = FALSE,
  spatial_grid_name = "spatial_grid",
  grid_color = NULL,
  show_other_cells = TRUE,
  other_cell_color = "lightgrey",
  other_point_size = 1,
  other_cells_alpha = 0.1,
  coord_fix_ratio = 1,
  title = NULL,
  show_legend = TRUE,
  show_axes = NULL,
  legend_text = 10,
  legend_symbol_size = 2,
  background_color = "white",
  vor_border_color = "white",
  vor_max_radius = 200,
  vor_alpha = 1,
  axis_text = 8,
  axis_title = 8,
  cow_n_col = NULL,
  cow_rel_h = 1,
  cow_rel_w = 1,
  cow_align = "h",
  show_plot = NULL,
  return_plot = NULL,
  save_plot = NULL,
  save_param = list(),
  theme_param = list(),
  default_save_name = "spatPlot2D"
)

spatPlot(...)

spatPlot3D(
  gobject,
  spat_unit = NULL,
  feat_type = NULL,
  sdimx = "sdimx",
  sdimy = "sdimy",
  sdimz = "sdimz",
  spat_enr_names = NULL,
  point_size = 3,
  point_alpha = 1,
  cell_color = NULL,
  cell_color_code = NULL,
  cell_color_gradient = NULL,
  color_as_factor = TRUE,
  gradient_limits = NULL,
  gradient_style = "divergent",
  gradient_midpoint = NULL,
  select_cell_groups = NULL,
  select_cells = NULL,
  show_other_cells = TRUE,
  other_cell_color = "lightgrey",
  other_point_size = 3,
  other_cell_alpha = 0.5,
  show_network = FALSE,
  spatial_network_name = "Delaunay_network",
  network_color = NULL,
  network_alpha = 1,
  show_grid = FALSE,
  spatial_grid_name = "spatial_grid",
  grid_color = NULL,
  grid_alpha = 1,
  title = "",
  show_legend = TRUE,
  axis_scale = c("cube", "real", "custom"),
  custom_ratio = NULL,
  x_ticks = NULL,
  y_ticks = NULL,
  z_ticks = NULL,
  show_plot = NULL,
  return_plot = NULL,
  save_plot = NULL,
  save_param = list(),
  default_save_name = "spat3D"
)
Arguments
- gobject
giotto object
- spat_unit
spatial unit (e.g. "cell")
- feat_type
feature type (e.g. "rna", "dna", "protein")
- plot_method
method to plot points. Either "ggplot" (default) or "scattermore" (rasterized and faster for large datasets)
- show_image
show a tissue background image
- gimage
a giotto image
- image_name
name of a giotto image or multiple images with group_by
- largeImage_name
deprecated. Use
image_name- group_by
character. Create multiple plots based on cell annotation column
- group_by_subset
character. subset the group_by factor column
- spat_loc_name
name of spatial locations
- sdimx
x-axis dimension name (default = 'sdimx')
- sdimy
y-axis dimension name (default = 'sdimy')
- spat_enr_names
character. names of spatial enrichment results to include
- cell_color
character. what to color cells by (e.g. metadata col or spatial enrichment col)
- color_as_factor
logical. convert color column to factor. Discrete colors are used when this is TRUE. continuous colors when FALSE.
- cell_color_code
character. discrete colors to use. palette to use or named vector of colors
- cell_color_gradient
character. continuous colors to use. palette to use or vector of colors to use (minimum of 2).
- gradient_midpoint
midpoint for color gradient
- gradient_style
either 'divergent' (midpoint is used in color scaling) or 'sequential' (scaled based on data range)
- gradient_limits
vector with lower and upper limits
- select_cell_groups
select subset of cells/clusters based on cell_color parameter
- select_cells
select subset of cells based on cell IDs
- point_shape
shape of points (border, no_border or voronoi)
- point_size
size of point (cell)
- point_alpha
transparancy of point
- point_border_col
color of border around points
- point_border_stroke
stroke size of border around points
- show_cluster_center
plot center of selected clusters
- show_center_label
plot label of selected clusters
- center_point_size
size of center points
- center_point_border_col
border color of center points
- center_point_border_stroke
border stroke size of center points
- label_size
size of labels
- label_fontface
font of labels
- show_network
show underlying spatial network
- spatial_network_name
name of spatial network to use
- network_color
color of spatial network
- network_alpha
alpha of spatial network
- show_grid
show spatial grid
- spatial_grid_name
name of spatial grid to use
- grid_color
color of spatial grid
- show_other_cells
display not selected cells
- other_cell_color
color of not selected cells
- other_point_size
point size of not selected cells
- other_cells_alpha
alpha of not selected cells
- coord_fix_ratio
fix ratio between x and y-axis (default = 1)
- title
title of plot
- show_legend
show legend
- show_axes
logical. show axes
- legend_text
size of legend text
- legend_symbol_size
size of legend symbols
- background_color
color of plot background
- vor_border_color
border color for voronoi plot
- vor_max_radius
maximum radius for voronoi 'cells'
- vor_alpha
transparency of voronoi 'cells'
- axis_text
size of axis text
- axis_title
size of axis title
- cow_n_col
cowplot param: how many columns
- cow_rel_h
cowplot param: relative heights of rows (e.g. c(1,2))
- cow_rel_w
cowplot param: relative widths of columns (e.g. c(1,2))
- cow_align
cowplot param: how to align
- show_plot
logical. show plot
- return_plot
logical. return ggplot object
- save_plot
logical. save the plot
- save_param
list of saving parameters, see
showSaveParameters- theme_param
list of additional params passed to
ggplot2::theme()- default_save_name
default save name for saving, don't change, change save_name in save_param
- ...
spatPLot(...) passes to spatPlot2D
- sdimz
z-axis dimension name (default = 'sdimy'). Can be set to
NULLto force 2D plotting with plotly- other_cell_alpha
(0 to 1) alpha for not selected cells
- grid_alpha
opacity of spatial grid
- axis_scale
the way to scale the axis
- custom_ratio
customize the scale of the plot
- x_ticks
set the number of ticks on the x-axis
- y_ticks
set the number of ticks on the y-axis
- z_ticks
set the number of ticks on the z-axis
Examples
# 2D Data %%%%%%%%%%%%%%%%%%%%%%%%%%%%%%%%%%%%%%%%%%%%
g <- GiottoData::loadGiottoMini("visium", verbose = FALSE)
spatPlot(g, show_image = TRUE, image_name = "image")
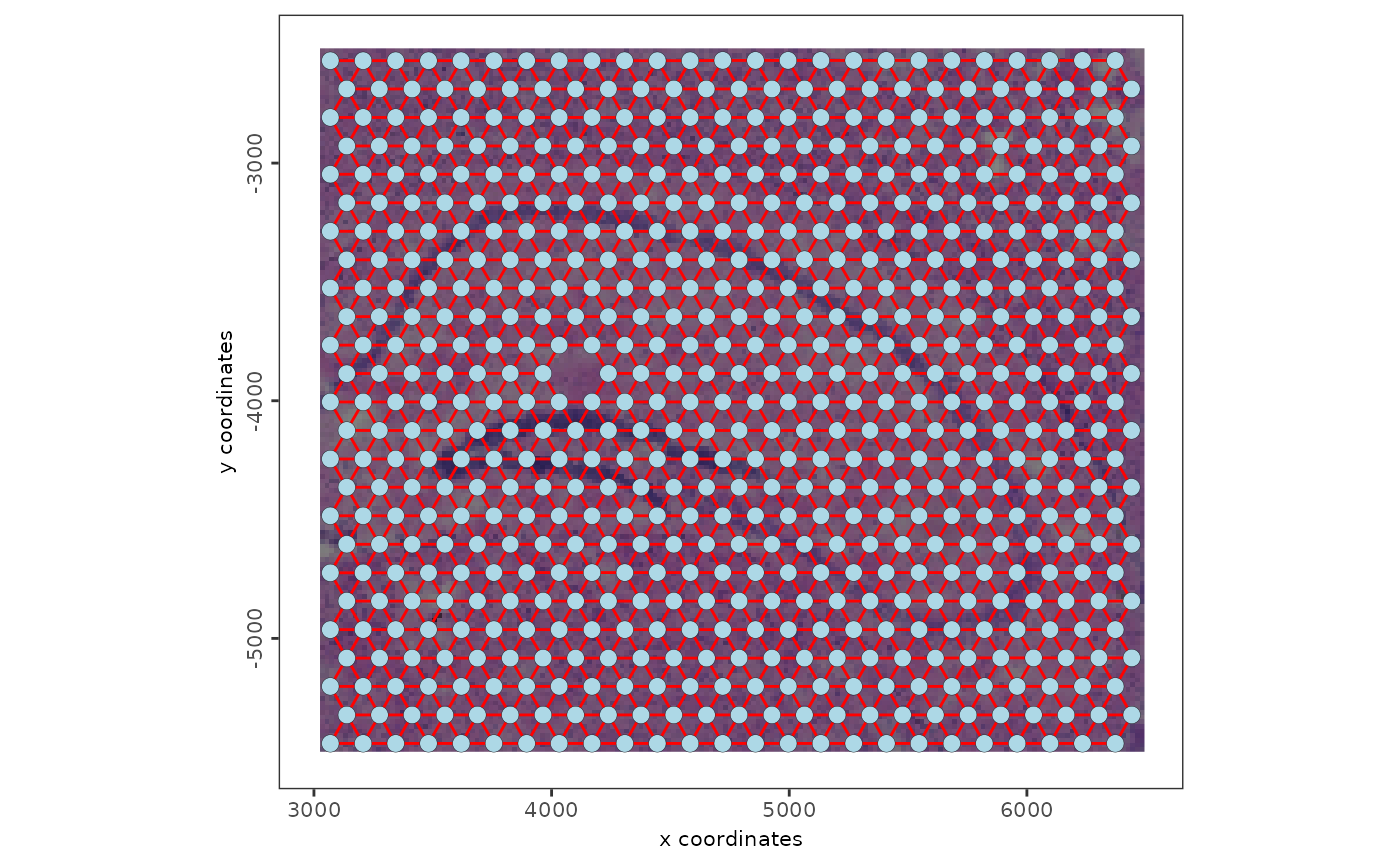
 # the more specific spatPlot2D with networks shown
spatPlot2D(g, show_image = TRUE, image_name = "image", show_network = TRUE)
# the more specific spatPlot2D with networks shown
spatPlot2D(g, show_image = TRUE, image_name = "image", show_network = TRUE)
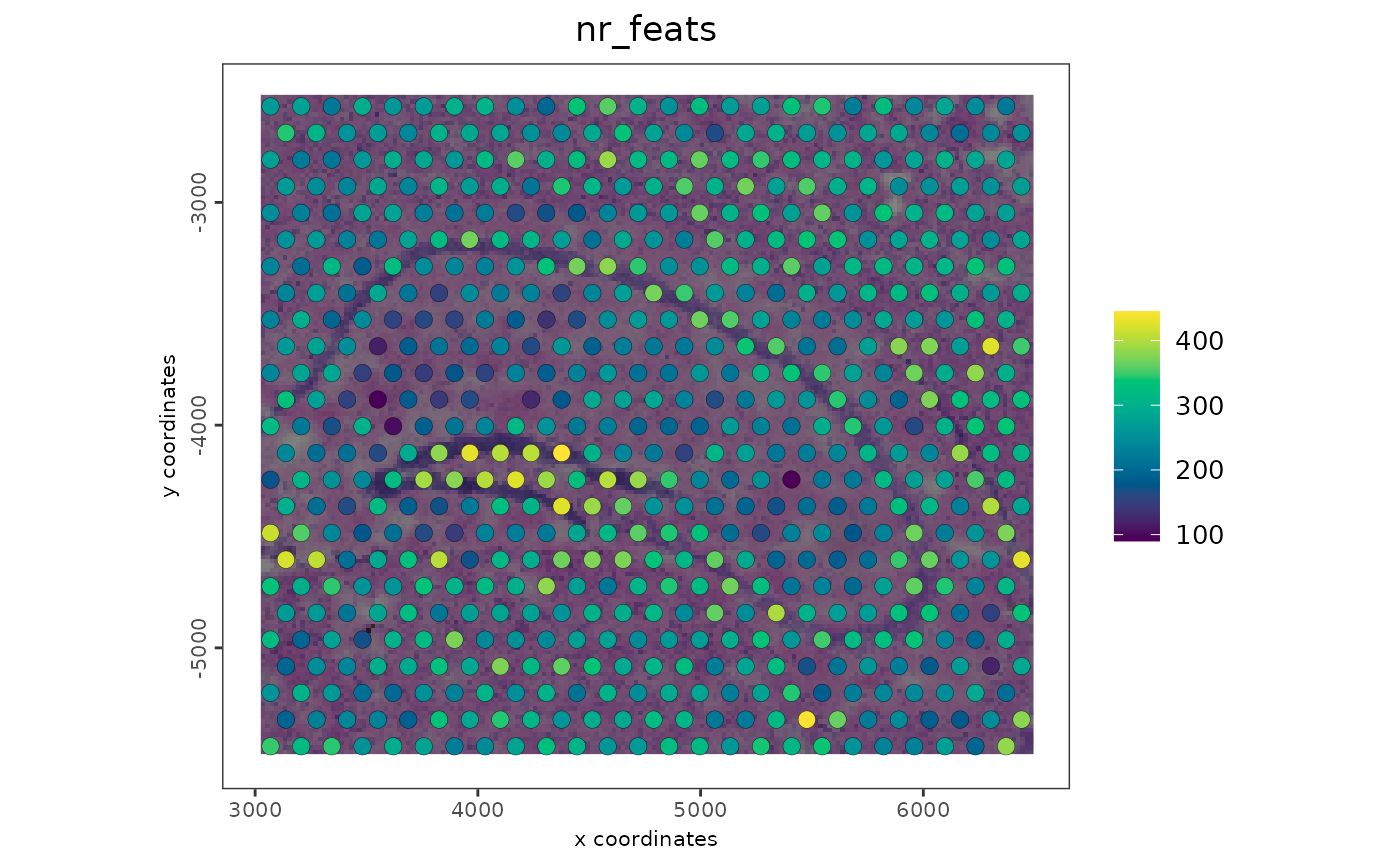
 # plotting of some cell metadata (number of different features detected)
spatPlot2D(g,
show_image = TRUE,
image_name = "image",
cell_color = "nr_feats",
color_as_factor = FALSE,
gradient_style = "sequential"
)
# plotting of some cell metadata (number of different features detected)
spatPlot2D(g,
show_image = TRUE,
image_name = "image",
cell_color = "nr_feats",
color_as_factor = FALSE,
gradient_style = "sequential"
)
 # 3D Data %%%%%%%%%%%%%%%%%%%%%%%%%%%%%%%%%%%%%%%%%%%%
starmap <- GiottoData::loadGiottoMini("starmap", verbose = FALSE)
# default is to rescale plot as a 3D cube
spatPlot3D(starmap, cell_color = "leiden_clus")
# real scaling
spatPlot3D(starmap, cell_color = "leiden_clus", axis_scale = "real")
# plot with selected cell groups
spatPlot3D(starmap,
cell_color = "cell_types",
color_as_factor = TRUE,
select_cell_groups = c("cell F", "cell C", "cell A"),
other_point_size = 1
)
# use the "sequential" style gradient default
spatPlot3D(starmap,
cell_color = "total_expr",
color_as_factor = FALSE,
point_alpha = 0.5,
axis_scale = "real",
gradient_style = "sequential"
)
# specific color gradient
spatPlot3D(starmap,
cell_color = "total_expr",
color_as_factor = FALSE,
point_alpha = 0.7,
axis_scale = "cube",
cell_color_gradient = "mako"
)
# 3D Data %%%%%%%%%%%%%%%%%%%%%%%%%%%%%%%%%%%%%%%%%%%%
starmap <- GiottoData::loadGiottoMini("starmap", verbose = FALSE)
# default is to rescale plot as a 3D cube
spatPlot3D(starmap, cell_color = "leiden_clus")
# real scaling
spatPlot3D(starmap, cell_color = "leiden_clus", axis_scale = "real")
# plot with selected cell groups
spatPlot3D(starmap,
cell_color = "cell_types",
color_as_factor = TRUE,
select_cell_groups = c("cell F", "cell C", "cell A"),
other_point_size = 1
)
# use the "sequential" style gradient default
spatPlot3D(starmap,
cell_color = "total_expr",
color_as_factor = FALSE,
point_alpha = 0.5,
axis_scale = "real",
gradient_style = "sequential"
)
# specific color gradient
spatPlot3D(starmap,
cell_color = "total_expr",
color_as_factor = FALSE,
point_alpha = 0.7,
axis_scale = "cube",
cell_color_gradient = "mako"
)