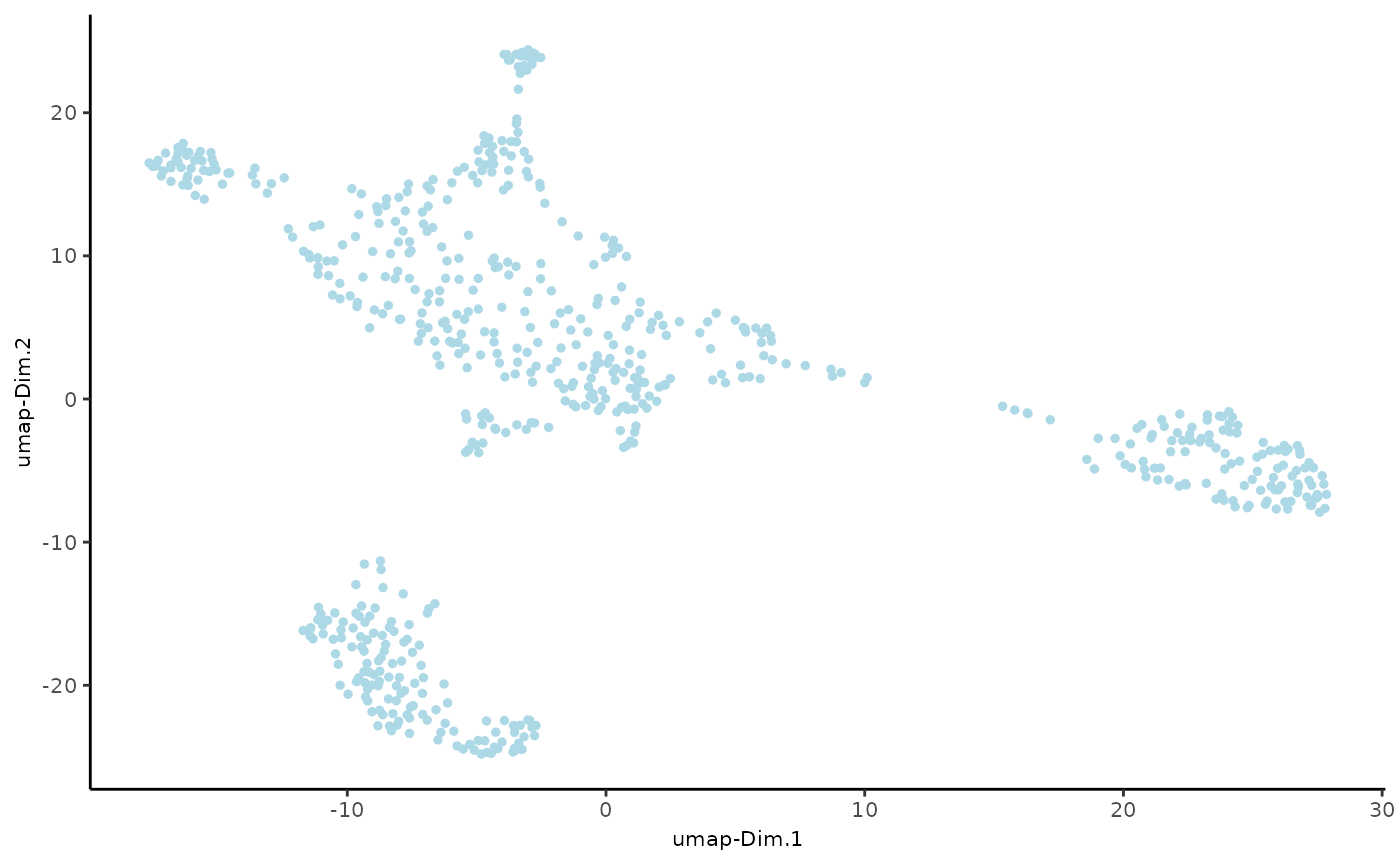
Short wrapper for UMAP visualization
Arguments
- gobject
giotto object
- dim_reduction_name
name of UMAP
- default_save_name
default save name of UMAP plot
- ...
Arguments passed on to
dimPlot2Dspat_unitspatial unit (e.g. "cell")
feat_typefeature type (e.g. "rna", "dna", "protein")
show_plotlogical. show plot
return_plotlogical. return ggplot object
save_plotlogical. save the plot
save_paramlist of saving parameters, see
showSaveParametersdim1_to_usenumeric. dimension to use on x-axis
dim2_to_usenumeric. dimension to use on y-axis
show_NN_networklogical. Show underlying NN network
nn_network_to_usecharacter. type of NN network to use (kNN vs sNN)
network_namecharacter. name of NN network to use, if show_NN_network = TRUE
spat_enr_namescharacter. names of spatial enrichment results to include
cell_colorcharacter. what to color cells by (e.g. metadata col or spatial enrichment col)
color_as_factorlogical. convert color column to factor. Discrete colors are used when this is TRUE. continuous colors when FALSE.
cell_color_codecharacter. discrete colors to use. palette to use or named vector of colors
cell_color_gradientcharacter. continuous colors to use. palette to use or vector of colors to use (minimum of 2).
cow_n_colcowplot param: how many columns
cow_rel_hcowplot param: relative heights of rows (e.g. c(1,2))
cow_rel_wcowplot param: relative widths of columns (e.g. c(1,2))
cow_aligncowplot param: how to align
group_bycharacter. Create multiple plots based on cell annotation column
group_by_subsetcharacter. subset the group_by factor column
gradient_midpointnumeric. midpoint for color gradient
gradient_styleeither 'divergent' (midpoint is used in color scaling) or 'sequential' (scaled based on data range)
gradient_limitsnumeric vector with lower and upper limits
select_cell_groupsselect subset of cells/clusters based on cell_color parameter
select_cellsselect subset of cells based on cell IDs
show_other_cellsdisplay not selected cells
other_cell_colorcolor for not selected cells
other_point_sizepoint size for not selected cells
show_cluster_centerplot center of selected clusters
show_center_labelplot label of selected clusters
center_point_sizesize of center points
center_point_border_colborder color of center points
center_point_border_strokeborder stroke size of center points
label_sizesize of labels
label_fontfacefont of labels
edge_alphacolumn to use for alpha of the edges
point_shapepoint with border or not (border or no_border)
point_sizesize of point (cell)
point_alphatransparency of points
point_border_colcolor of border around points
point_border_strokestroke size of border around points
titlecharacter. title for plot, defaults to cell_color parameter
show_legendlogical. show legend
legend_textsize of legend text
legend_symbol_sizesize of legend symbols
background_colorcolor of plot background
axis_textsize of axis text
axis_titlesize of axis title
See also
Other reduced dimension visualizations:
dimPlot2D(),
plotPCA(),
plotPCA_2D(),
plotPCA_3D(),
plotTSNE(),
plotTSNE_2D(),
plotTSNE_3D(),
plotUMAP_2D(),
plotUMAP_3D()
Examples
g <- GiottoData::loadGiottoMini("visium", verbose = FALSE)
plotUMAP(g)