Utility class for defining pixel-exact tiles of images.
Arguments
- pxdims
numeric of length 2. Pixel dimensions
c(nrow, ncol)of the image to iterate across. Equivalent tox$pxdims <- value.- ncols
numeric. Tile width in pixels. Equivalent to
x$ncols <- value.- nrows
numeric. Tile height in pixels. Equivalent to
x$nrows <- value.- ...
additional params passed to
new().
Slots
pxdimspixel dimensions to iterate across
nnumeric. Number of tiles to create.
dimsnumeric. Number of rows/cols in the array of tiles
tile_dimsnumeric. Row/col dimensions of each tile
padnumeric. Tile padding
metadatadata.frame. Metadata per tile
Getting tile pixel indices
[i] and [i, j] indexing can be used to select tiles, similarly to a
matrix. [] without any indexing will return the entire set of indices
as a list. Indices are returned as lists of integer vectors of length 4,
with values xmin, xmax, ymin, ymax. Extracted vectors of indices will
have metadata attached via attr(). See metadata section below.
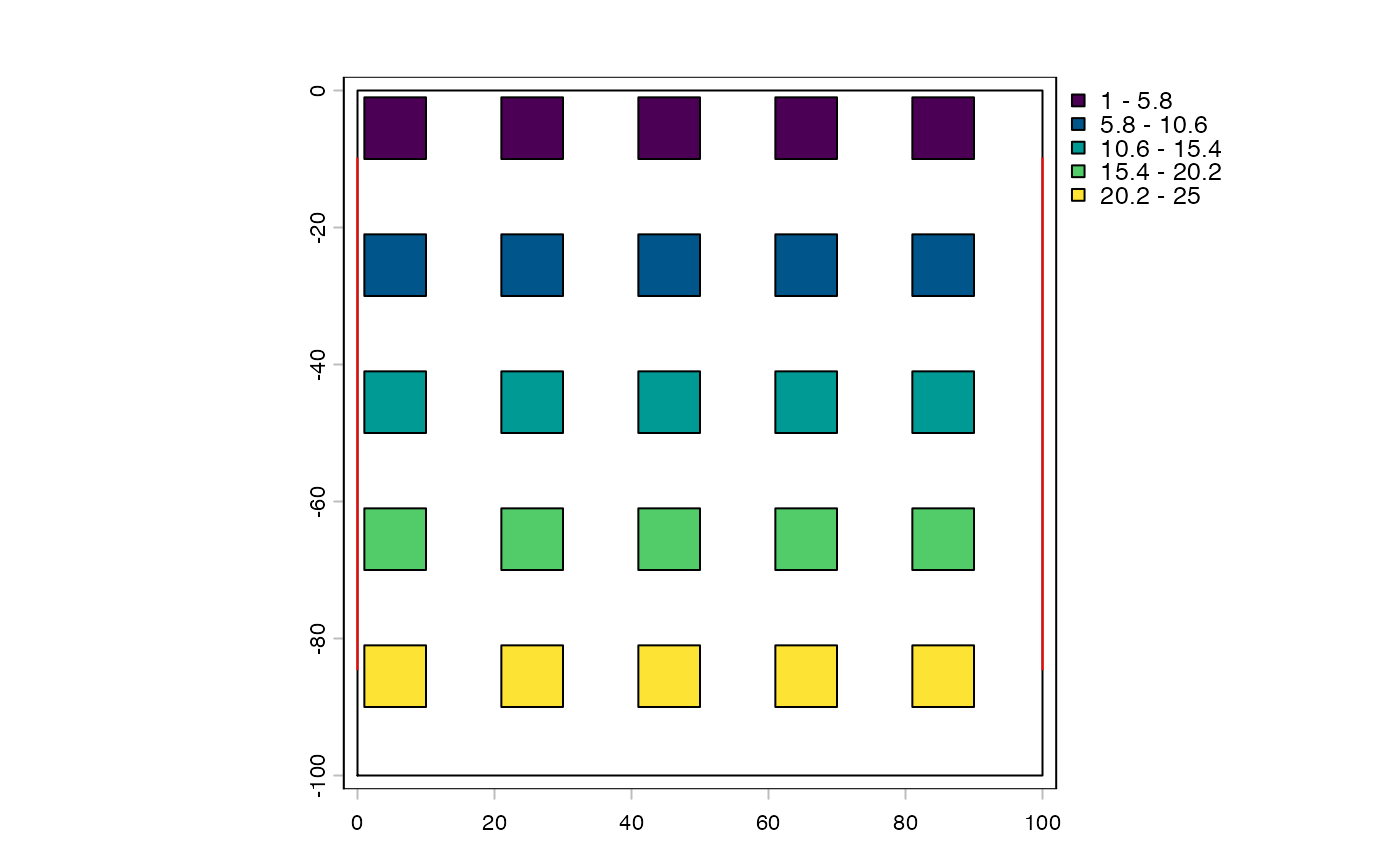
padding
+/- can be used to add or subtract padding to each of the tiles.
Each bound will be expanded by the pad value. Pad values may only be
integer values.
previewing tiles
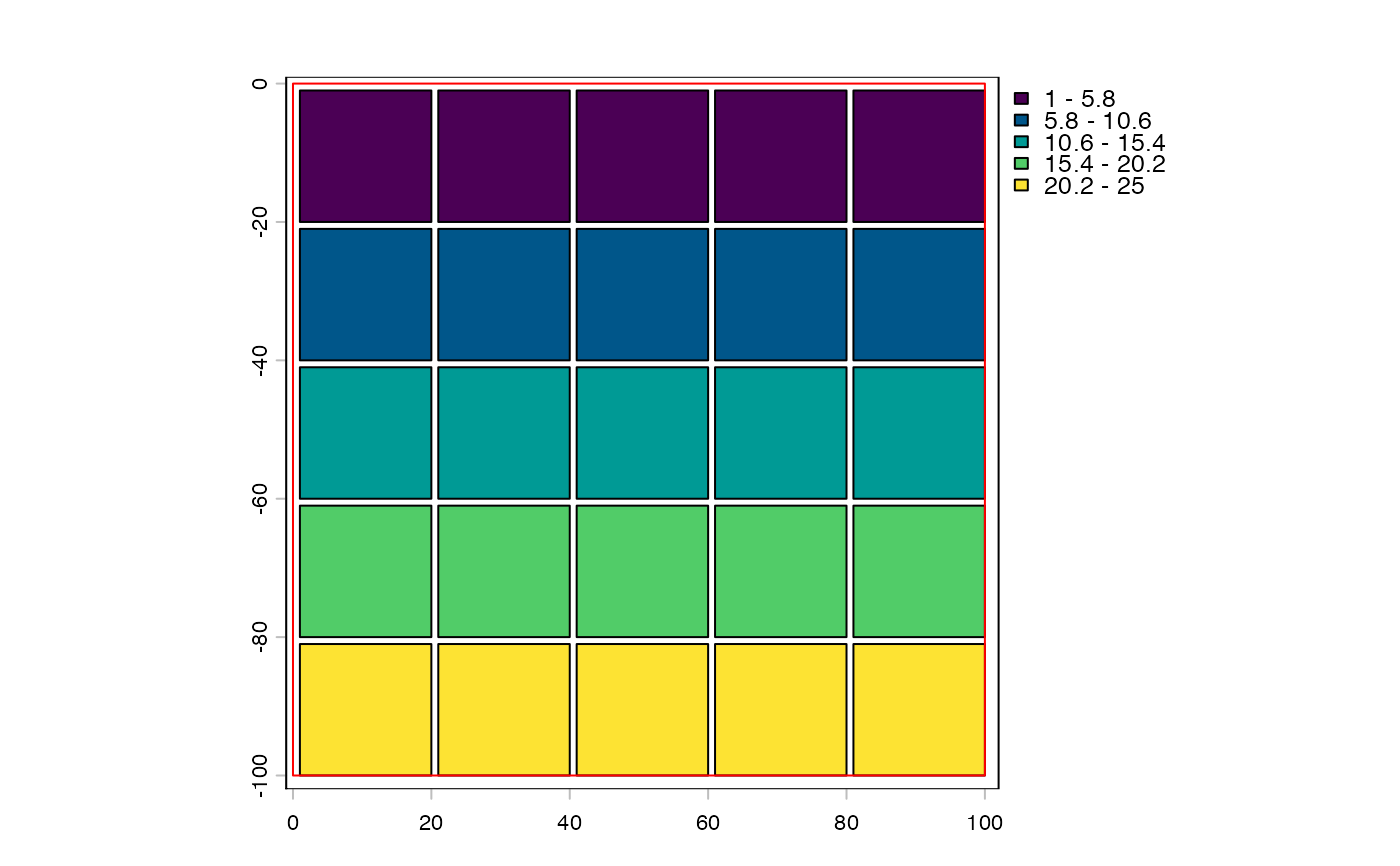
plot() can be used to check the layout of the tiles.
metadata
The pixelTilePlan object can contain metadata. By default after extent and
tiles setup, a column called "tile" will be set up that simply records
which tile it is.
$and$<-can be used to get and set specific metadata, the"pxdims"which are the pixel dimensions of the image to iterate across,"ncols"and"nrows"which are the px dims of a tile, and the"pad"value.[[i]]selection will pull specific metadata rows corresponding to the selected tiles.
See also
Other tile plans:
freeTilePlan,
freeTilePlan-class,
pointTilePlan-class,
quadtreePlan(),
spatialTilePlan-class,
tilePlan,
tilePlan-class,
tilework-class
Examples
x <- pixelTilePlan(pxdims = c(100, 100), ncols = 20)
length(x) # check how many tiles there are
#> [1] 25
dim(x)
#> [1] 5 5
nrow(x)
#> [1] 5
ncol(x)
#> [1] 5
# previewing
plot(x)
 # tile padding
y <- x + 3
plot(y, alpha = 0.3) # red border shows the image space
# tile padding
y <- x + 3
plot(y, alpha = 0.3) # red border shows the image space
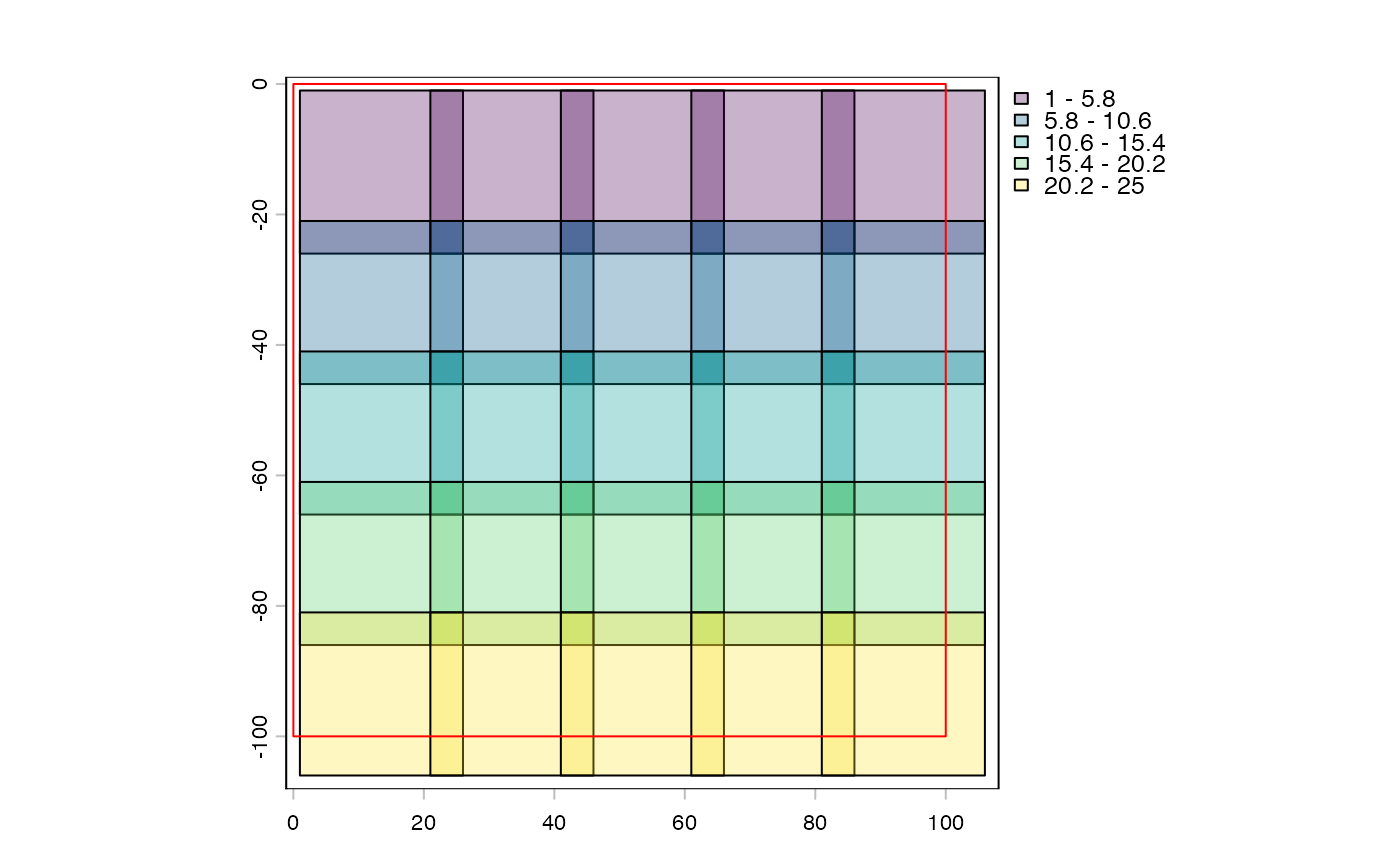 # this is now larger than the original space.
# negative padding
z <- x - 5
plot(ext(c(0, 100, -100, 0)))
plot(z, add = TRUE)
# this is now larger than the original space.
# negative padding
z <- x - 5
plot(ext(c(0, 100, -100, 0)))
plot(z, add = TRUE)
 # tile selection
x[5]
#> [[1]]
#> [1] 81 100 1 20
#> attr(,"tile")
#> [1] 5
#>
x[2, 2:3]
#> [[1]]
#> [1] 21 40 21 40
#> attr(,"tile")
#> [1] 7
#>
#> [[2]]
#> [1] 41 60 21 40
#> attr(,"tile")
#> [1] 8
#>
# metadata
x$tile
#> [1] 1 2 3 4 5 6 7 8 9 10 11 12 13 14 15 16 17 18 19 20 21 22 23 24 25
x$fname <- sprintf("tile_%03d.tif", x$tile)
x[[5]]
#> tile fname
#> 5 5 tile_005.tif
x[[1:3]]$fname
#> [1] "tile_001.tif" "tile_002.tif" "tile_003.tif"
# tile selection
x[5]
#> [[1]]
#> [1] 81 100 1 20
#> attr(,"tile")
#> [1] 5
#>
x[2, 2:3]
#> [[1]]
#> [1] 21 40 21 40
#> attr(,"tile")
#> [1] 7
#>
#> [[2]]
#> [1] 41 60 21 40
#> attr(,"tile")
#> [1] 8
#>
# metadata
x$tile
#> [1] 1 2 3 4 5 6 7 8 9 10 11 12 13 14 15 16 17 18 19 20 21 22 23 24 25
x$fname <- sprintf("tile_%03d.tif", x$tile)
x[[5]]
#> tile fname
#> 5 5 tile_005.tif
x[[1:3]]$fname
#> [1] "tile_001.tif" "tile_002.tif" "tile_003.tif"