Giotto
4.2.1
- Get started
- Documentation
- Examples
- Tutorials
- News
- Contributing
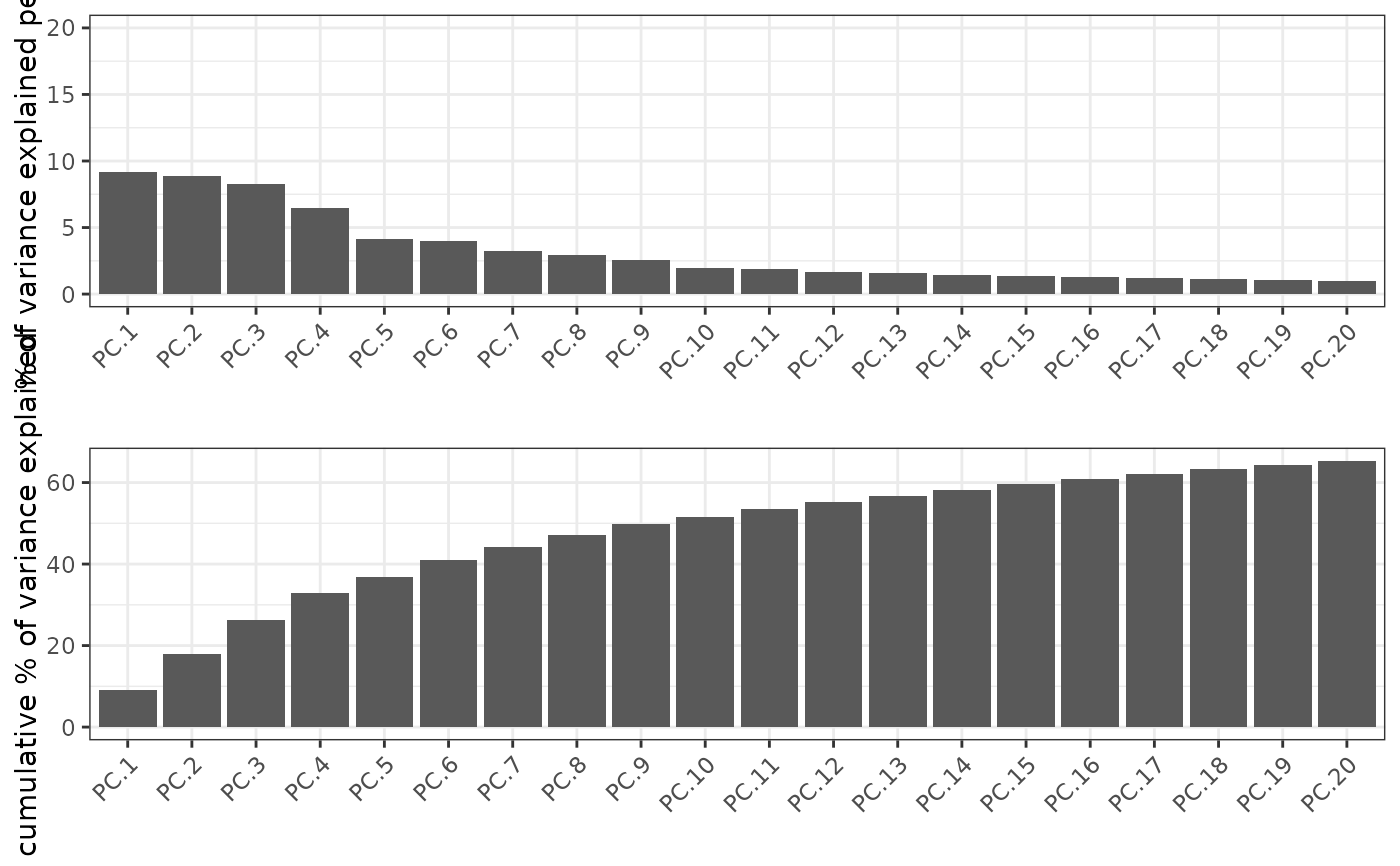
create screeplot with ggplot
create_screeplot(eigs, ncp = 20, ylim = c(0, 20))Arguments
Value
ggplot
Examples
dr <- GiottoData::loadSubObjectMini("dimObj")
scree <- create_screeplot(methods::slot(dr, "misc")$eigenvalues)
scree