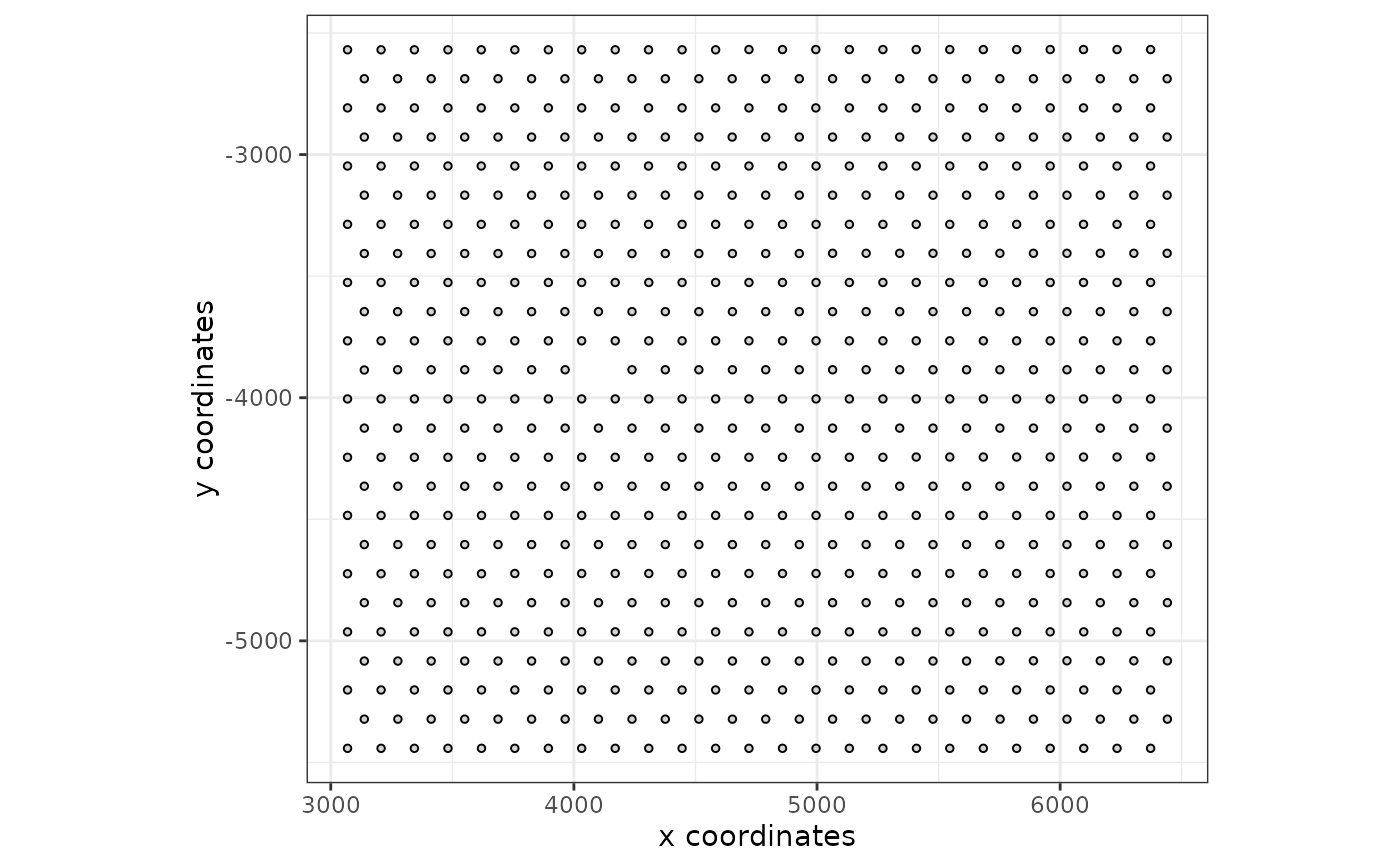
Visualize cell-cell interactions according to spatial coordinates
cellProximityVisPlot(
  gobject,
  interaction_name = NULL,
  cluster_column = NULL,
  sdimx = NULL,
  sdimy = NULL,
  sdimz = NULL,
  cell_color = NULL,
  cell_color_code = NULL,
  color_as_factor = TRUE,
  show_other_cells = FALSE,
  show_network = FALSE,
  show_other_network = FALSE,
  network_color = NULL,
  spatial_network_name = "Delaunay_network",
  show_grid = FALSE,
  grid_color = NULL,
  spatial_grid_name = "spatial_grid",
  coord_fix_ratio = 1,
  show_legend = TRUE,
  point_size_select = 2,
  point_select_border_col = "black",
  point_select_border_stroke = 0.05,
  point_size_other = 1,
  point_alpha_other = 0.3,
  point_other_border_col = "lightgrey",
  point_other_border_stroke = 0.01,
  axis_scale = c("cube", "real", "custom"),
  custom_ratio = NULL,
  x_ticks = NULL,
  y_ticks = NULL,
  z_ticks = NULL,
  plot_method = c("ggplot", "plotly"),
  ...
)
Arguments
- gobject
giotto object
- interaction_name
cell-cell interaction name
- cluster_column
cluster column with cell clusters
- sdimx
x-axis dimension name (default = 'sdimx')
- sdimy
y-axis dimension name (default = 'sdimy')
- sdimz
z-axis dimension name (default = 'sdimz')
- cell_color
color for cells (see details)
- cell_color_code
named vector with colors
- color_as_factor
convert color column to factor
- show_other_cells
show not selected cells
- show_network
show underlying spatial network
- show_other_network
show underlying spatial network of other cells
- network_color
color of spatial network
- spatial_network_name
name of spatial network to use
- show_grid
show spatial grid
- grid_color
color of spatial grid
- spatial_grid_name
name of spatial grid to use
- coord_fix_ratio
fix ratio between x and y-axis
- show_legend
show legend
- point_size_select
size of selected points
- point_select_border_col
border color of selected points
- point_select_border_stroke
stroke size of selected points
- point_size_other
size of other points
- point_alpha_other
alpha of other points
- point_other_border_col
border color of other points
- point_other_border_stroke
stroke size of other points
- axis_scale
scale of axis
- custom_ratio
custom ratio of scales
- x_ticks
x ticks
- y_ticks
y ticks
- z_ticks
z ticks
- plot_method
method to plot
- ...
additional parameters
Value
ggplot or plotly
Details
Description of parameters.
Examples
g <- GiottoData::loadGiottoMini("visium")
#> 1. read Giotto object
#> 2. read Giotto feature information
#> 3. read Giotto spatial information
#> 3.1 read Giotto spatial shape information
#> 3.2 read Giotto spatial centroid information
#> 3.3 read Giotto spatial overlap information
#> 4. read Giotto image information
#> python already initialized in this session
#>  active environment : '/usr/bin/python3'
#>  python version : 3.12
g <- createSpatialGrid(g, sdimx_stepsize = 5, sdimy_stepsize = 5)
x <- cellProximityEnrichment(g, cluster_column = "leiden_clus")

cellProximityVisPlot(
    gobject = g, interaction_name = x,
    cluster_column = "leiden_clus", sdimx = "sdimx", sdimy = "sdimy"
)
