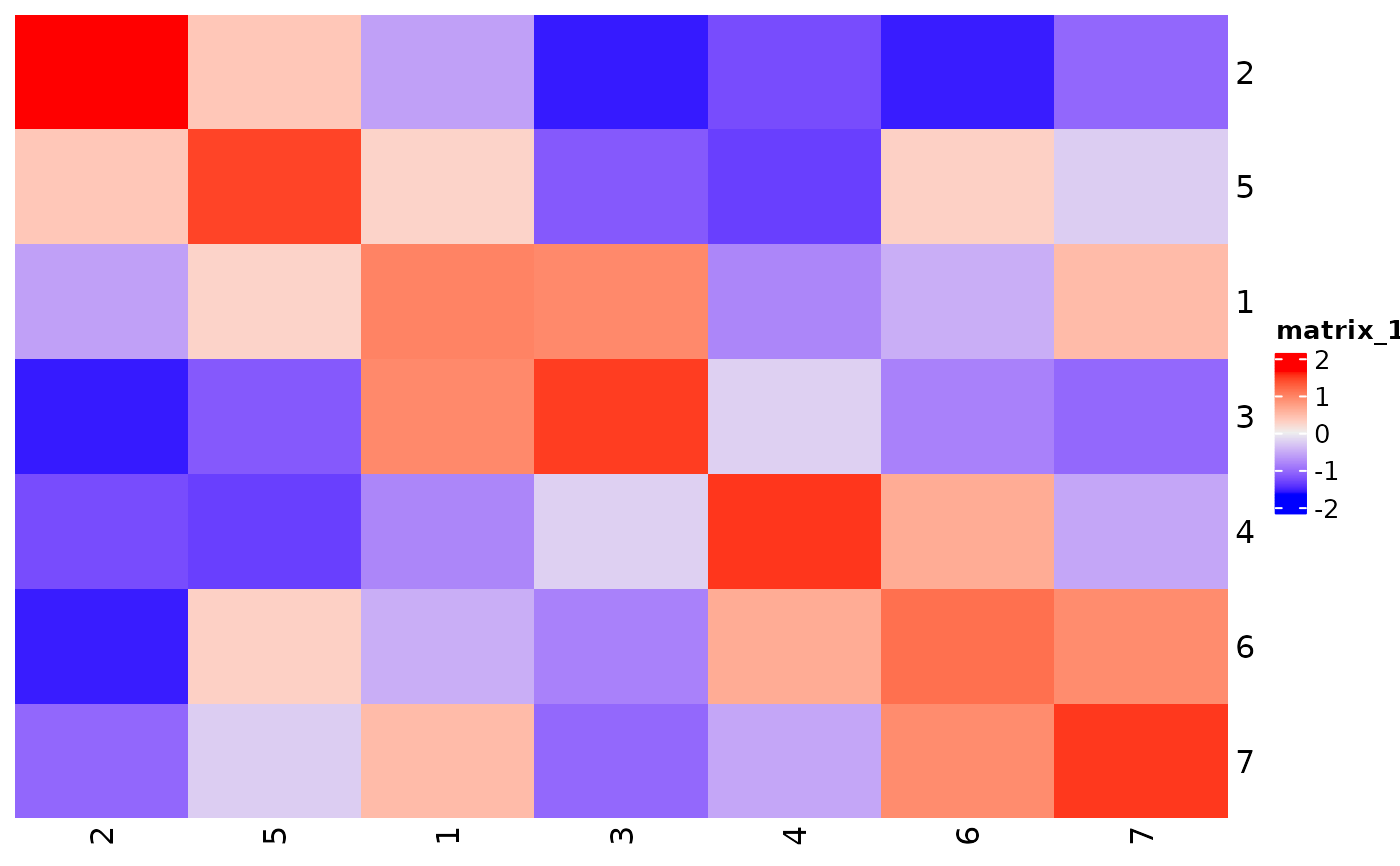
Create heatmap from cell-cell proximity scores
cellProximityHeatmap(
  gobject,
  CPscore,
  scale = TRUE,
  order_cell_types = TRUE,
  color_breaks = NULL,
  color_names = NULL,
  show_plot = NULL,
  return_plot = NULL,
  save_plot = NULL,
  save_param = list(),
  default_save_name = "cellProximityHeatmap"
)
Arguments
- gobject
giotto object
- CPscore
CPscore, output from cellProximityEnrichment()
- scale
scale cell-cell proximity interaction scores
- order_cell_types
order cell types based on enrichment correlation
- color_breaks
numerical vector of length 3 to represent min, mean and maximum
- color_names
character color vector of length 3
- show_plot
logical. show plot
- return_plot
logical. return ggplot object
- save_plot
logical. save the plot
- save_param
list of saving parameters, see
showSaveParameters- default_save_name
default save name for saving, don't change, change save_name in save_param
Value
ggplot heatmap
Details
This function creates a heatmap that shows the spatial proximity enrichment or depletion of cell type pairs.
Examples
g <- GiottoData::loadGiottoMini("visium")
#> 1. read Giotto object
#> 2. read Giotto feature information
#> 3. read Giotto spatial information
#> 3.1 read Giotto spatial shape information
#> 3.2 read Giotto spatial centroid information
#> 3.3 read Giotto spatial overlap information
#> 4. read Giotto image information
#> python already initialized in this session
#>  active environment : '/usr/bin/python3'
#>  python version : 3.12

x <- cellProximityEnrichment(g, cluster_column = "leiden_clus")

cellProximityHeatmap(gobject = g, CPscore = x)