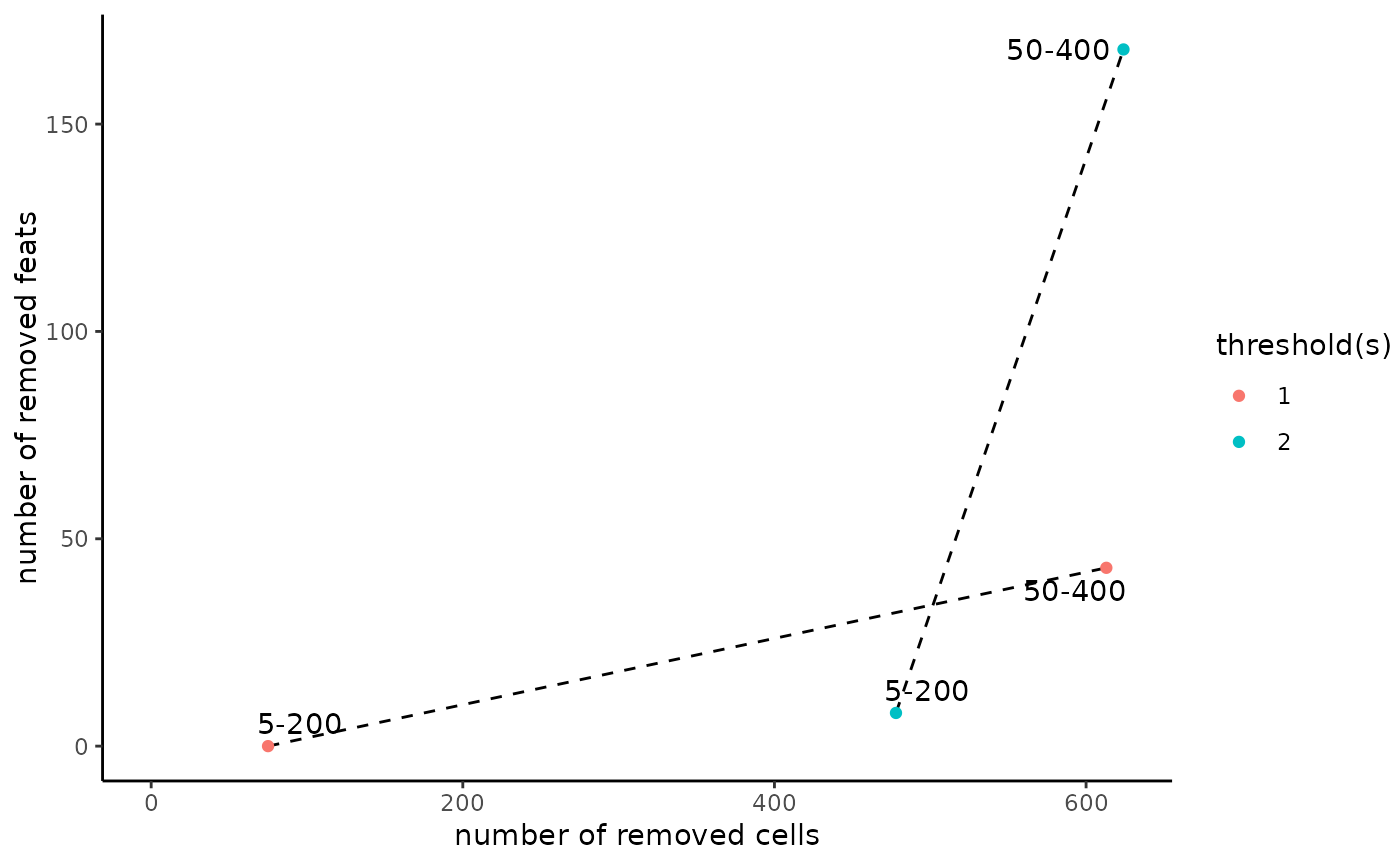
Shows how many genes and cells are lost with combinations of thresholds.
filterCombinations(
  gobject,
  feat_type = NULL,
  spat_unit = NULL,
  expression_values = c("raw", "normalized", "scaled", "custom"),
  expression_thresholds = c(1, 2),
  feat_det_in_min_cells = c(5, 50),
  min_det_feats_per_cell = c(200, 400),
  scale_x_axis = "identity",
  x_axis_offset = 0,
  scale_y_axis = "identity",
  y_axis_offset = 0,
  show_plot = TRUE,
  return_plot = FALSE,
  save_plot = NULL,
  save_param = list(),
  default_save_name = "filterCombinations"
)
Arguments
- gobject
giotto object
- feat_type
feature type (e.g. "rna", "dna", "protein")
- spat_unit
spatial unit (e.g. "cell")
- expression_values
expression values to use
- expression_thresholds
all thresholds to consider a gene expressed
- feat_det_in_min_cells
minimum # of cells that need to express a feature
- min_det_feats_per_cell
minimum # of features that need to be detected in a cell
- scale_x_axis
ggplot transformation for x-axis (e.g. log2)
- x_axis_offset
x-axis offset to be used together with the scaling transformation
- scale_y_axis
ggplot transformation for y-axis (e.g. log2)
- y_axis_offset
y-axis offset to be used together with the scaling transformation
- show_plot
logical. show plot
- return_plot
logical. return ggplot object
- save_plot
logical. save the plot
- save_param
list of saving parameters, see
showSaveParameters- default_save_name
default save name for saving, don't change, change save_name in save_param
Value
list of data.table and ggplot object
Details
Creates a scatterplot that visualizes the number of genes and cells that are lost with a specific combination of a gene and cell threshold given an arbitrary cutoff to call a gene expressed. This function can be used to make an informed decision at the filtering step with filterGiotto.
Examples
g <- GiottoData::loadGiottoMini("visium")
#> 1. read Giotto object
#> 2. read Giotto feature information
#> 3. read Giotto spatial information
#> 3.1 read Giotto spatial shape information
#> 3.2 read Giotto spatial centroid information
#> 3.3 read Giotto spatial overlap information
#> 4. read Giotto image information
#> python already initialized in this session
#>  active environment : '/usr/bin/python3'
#>  python version : 3.12

filterCombinations(g)