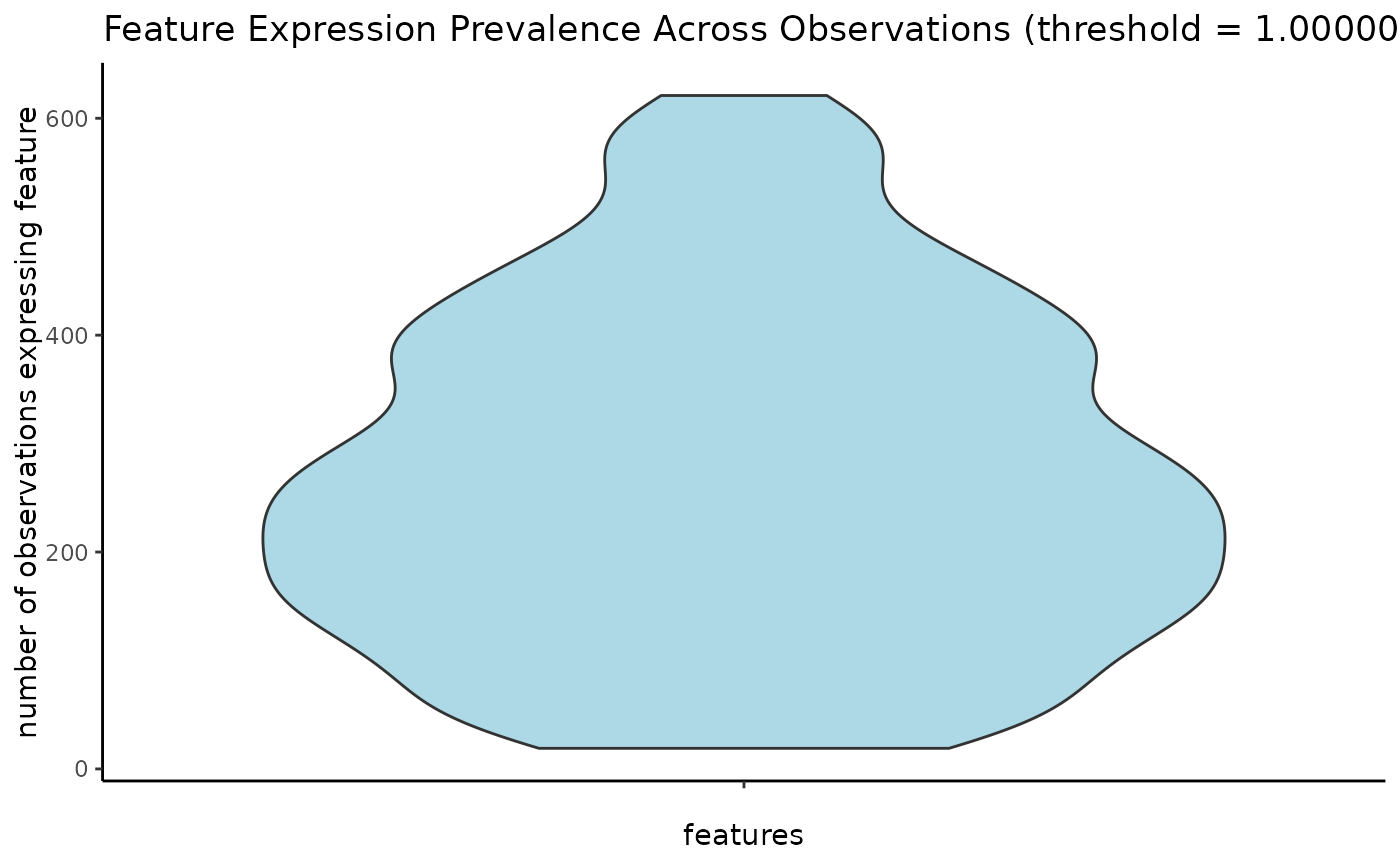
Show feature or cell distribution after filtering on expression threshold.
General sum and mean statistics for the expression values can also be
plotted, however these are not affected by the expression_threshold value.
filterDistributions(
  gobject,
  feat_type = NULL,
  spat_unit = NULL,
  expression_values = c("raw", "normalized", "scaled", "custom"),
  method = c("threshold", "sum", "mean"),
  expression_threshold = 1,
  detection = c("feats", "cells"),
  plot_type = c("histogram", "violin"),
  nr_bins = 30,
  fill_color = "lightblue",
  scale_y = "identity",
  scale_axis = "identity",
  axis_offset = 0,
  show_plot = NULL,
  return_plot = NULL,
  save_plot = NULL,
  save_param = list(),
  default_save_name = "filterDistributions"
)
Arguments
- gobject
giotto object
- feat_type
feature type (e.g. "rna", "dna", "protein")
- spat_unit
spatial unit (e.g. "cell")
- expression_values
character. Name of set of expression values to use. (default =
"raw")- method
character. One of
"threshold"(default),"sum","mean". Method to create distribution (see details)- expression_threshold
numeric (default = 1). Threshold to consider a feature expressed. Applied only for
method = "threshold"- detection
character. One of
"feats"(default) or"cells". Calculate statistics based on features (e.g. genes) or cells/observations- plot_type
character. One of
"histogram"(default) or"violin". Type of plot to create.- nr_bins
numeric. Number of bins for histogram plot
- fill_color
fill color for plots. (Default =
"lightblue")- scale_y
character. Scaling operation to apply on y-axis (e.g.
"log")- scale_axis
character. ggplot2 transformation for axis (e.g.
"log2"). This is passed to thetransformparam ofggplot2::scale_x_continuous()- axis_offset
numeric. offset to be used together with the scaling transformation
- show_plot
logical. show plot
- return_plot
logical. return ggplot object
- save_plot
logical. save the plot
- save_param
list of saving parameters, see
showSaveParameters- default_save_name
default save name for saving, don't change, change save_name in save_param
Value
ggplot object
Details
The distribution to plot is calculated based on the detection and method
params. detection decides if values are computed rowwise ("feats") or
colwise ("cells") across the feature x cell expression matrix.
method determines how the distribution is calculated:
"threshold"- calculate number of features that cross theexpression_threshold(default)"sum"- find the sum of the features, i.e. total of a feature across all observations."mean"- find the mean of the features, i.e. average expression
Examples
g <- GiottoData::loadGiottoMini("visium")
#> 1. read Giotto object
#> 2. read Giotto feature information
#> 3. read Giotto spatial information
#> 3.1 read Giotto spatial shape information
#> 3.2 read Giotto spatial centroid information
#> 3.3 read Giotto spatial overlap information
#> 4. read Giotto image information
#> python already initialized in this session
#> active environment : '/usr/bin/python3'
#> python version : 3.12
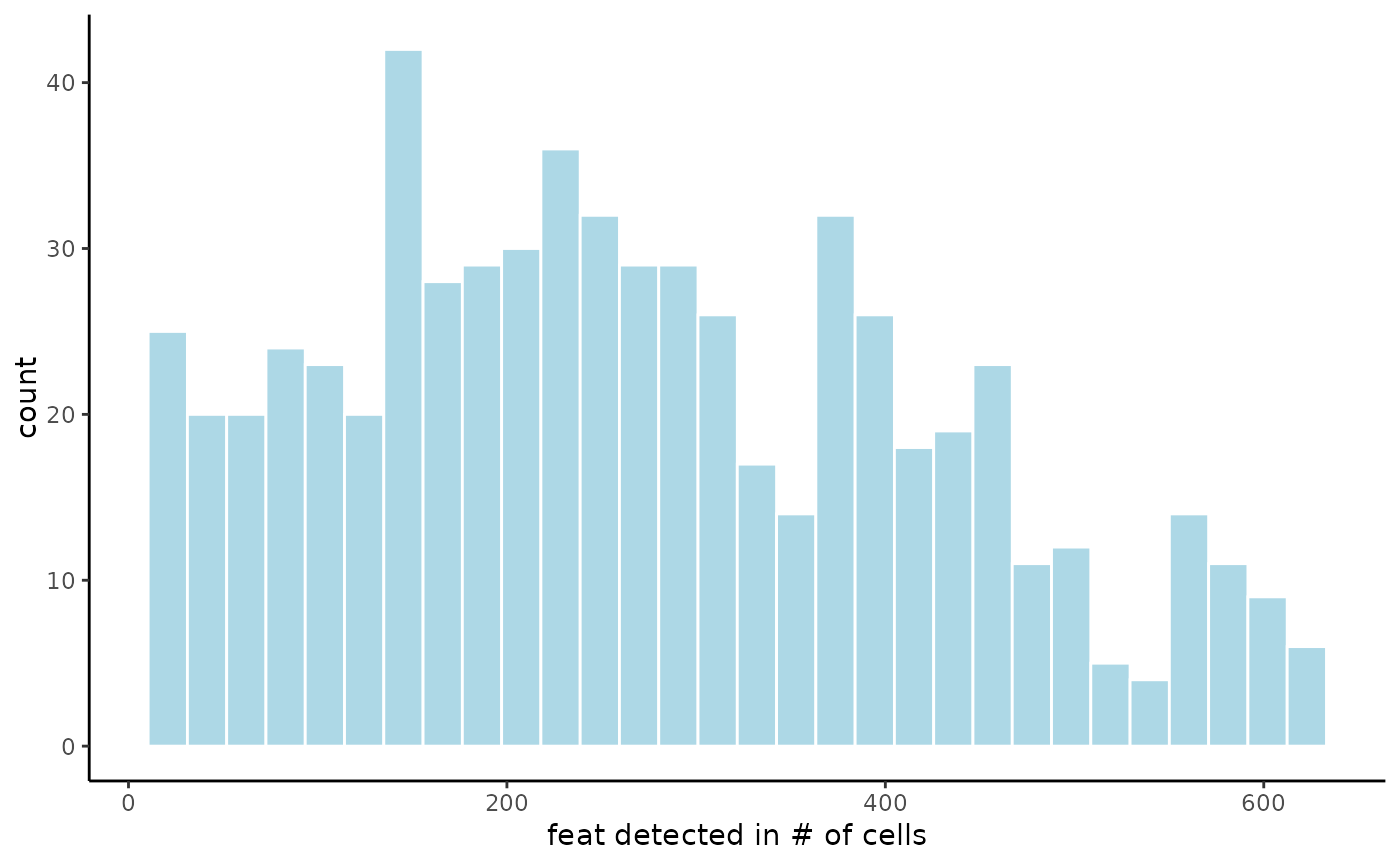
# visualize feature expression prevalence across observations (histogram)
filterDistributions(g)
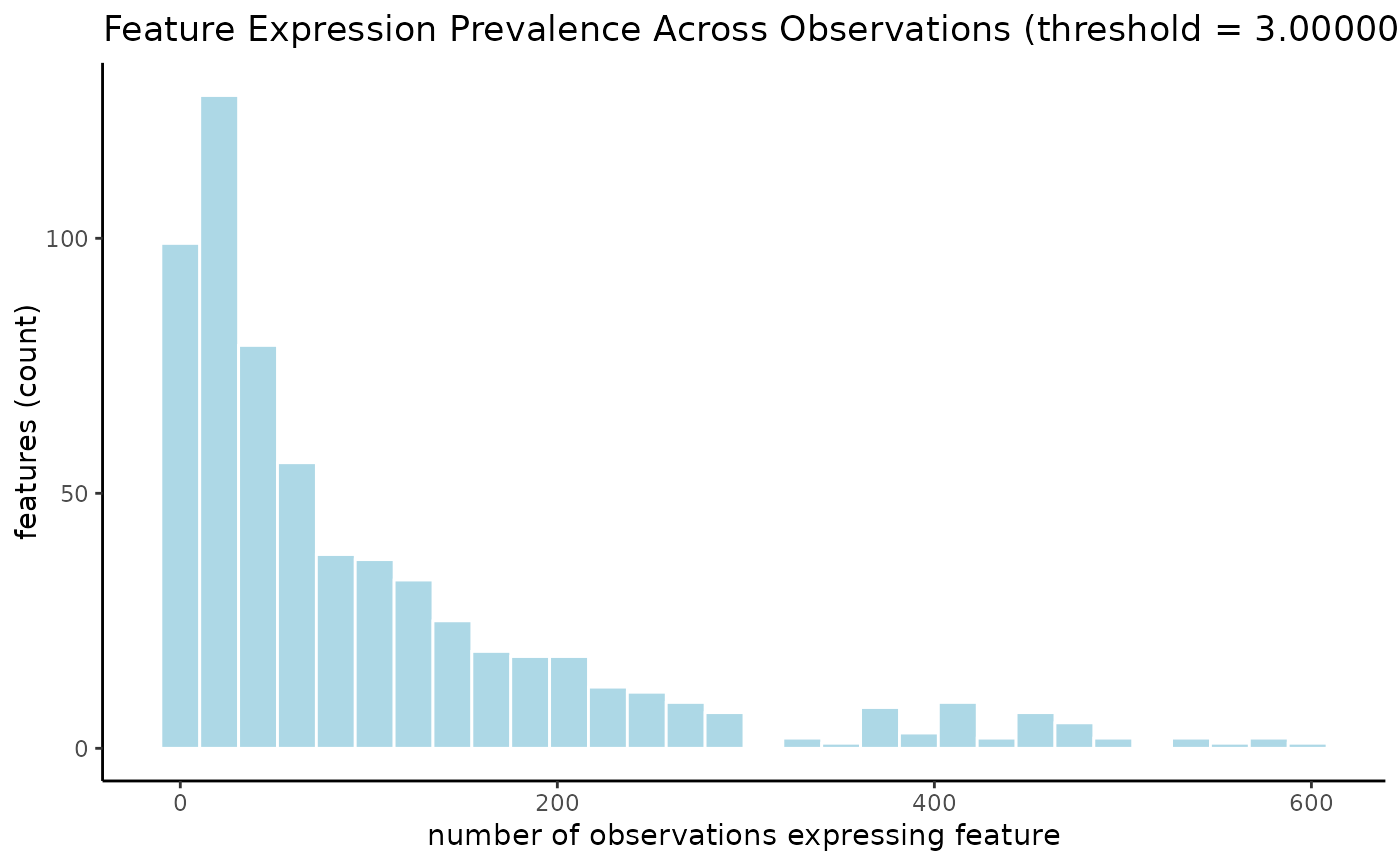
 # visualize with a threshold of 3
filterDistributions(g, expression_threshold = 3)
# visualize with a threshold of 3
filterDistributions(g, expression_threshold = 3)
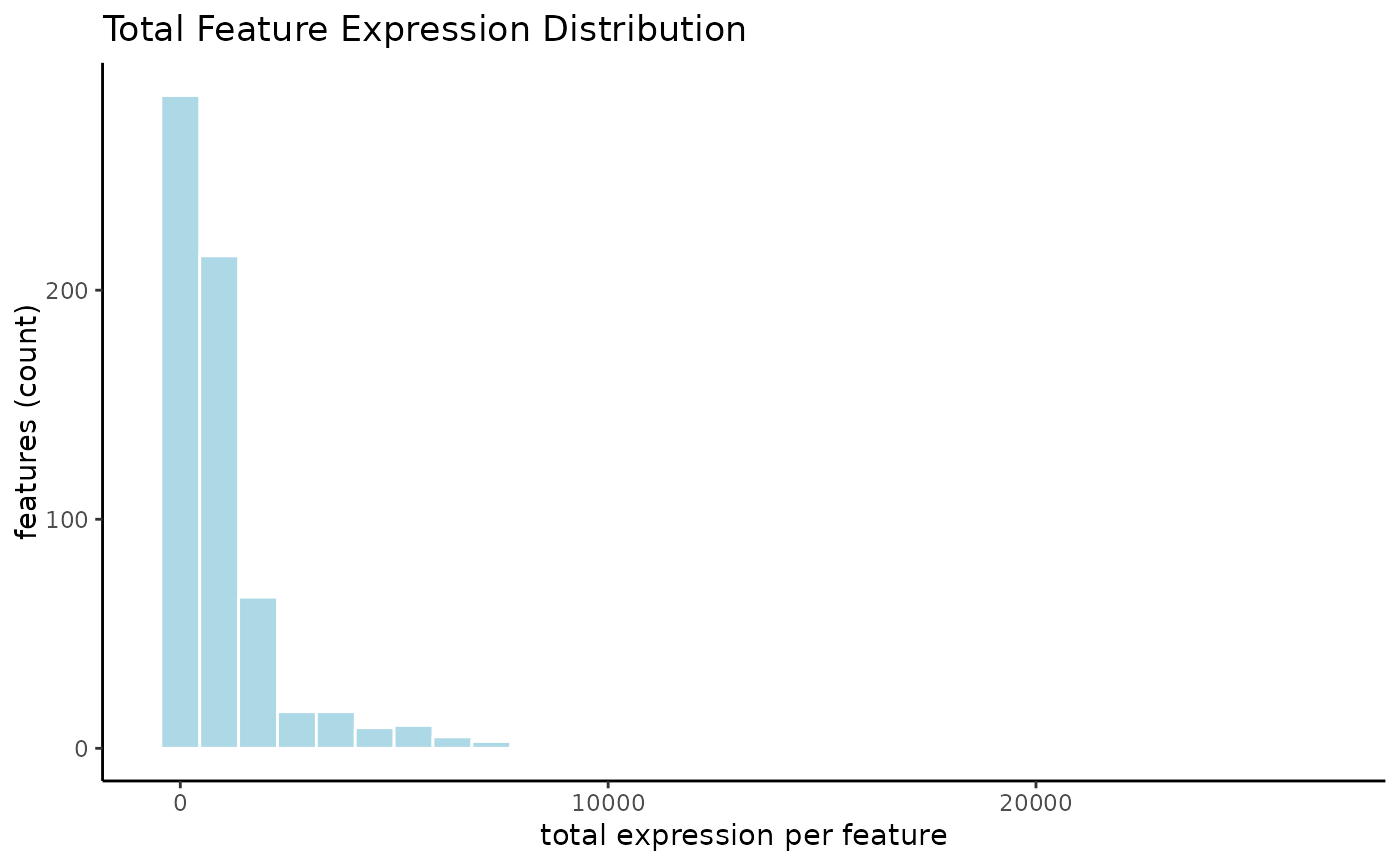
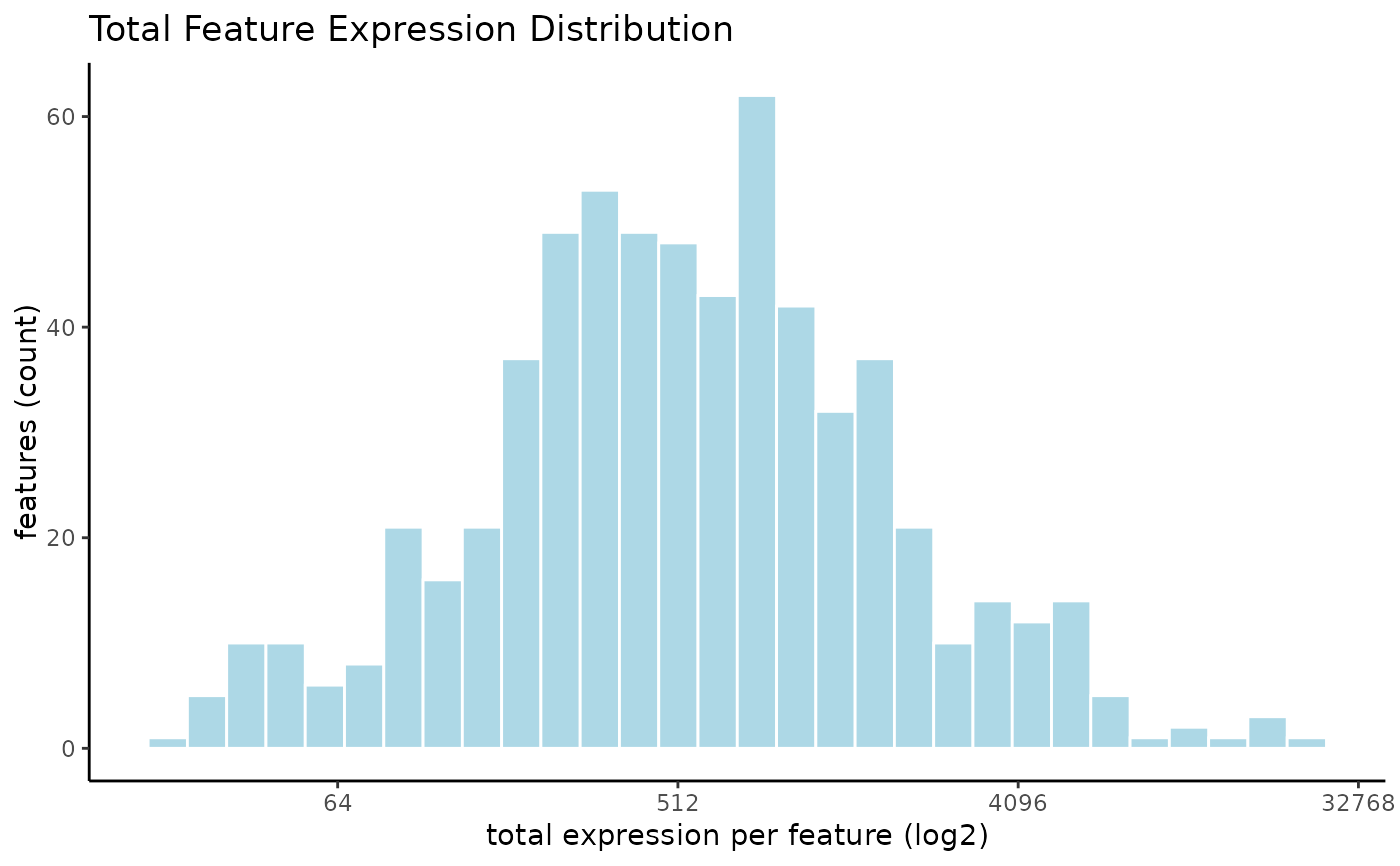
 # visualize sum of feature expression across dataset
filterDistributions(g, method = "sum")
# visualize sum of feature expression across dataset
filterDistributions(g, method = "sum")
 # visualize with a log scaling
filterDistributions(g, method = "sum", scale_axis = "log2")
# visualize with a log scaling
filterDistributions(g, method = "sum", scale_axis = "log2")
 # visualize as violinplot
filterDistributions(g, plot_type = "violin")
# visualize as violinplot
filterDistributions(g, plot_type = "violin")
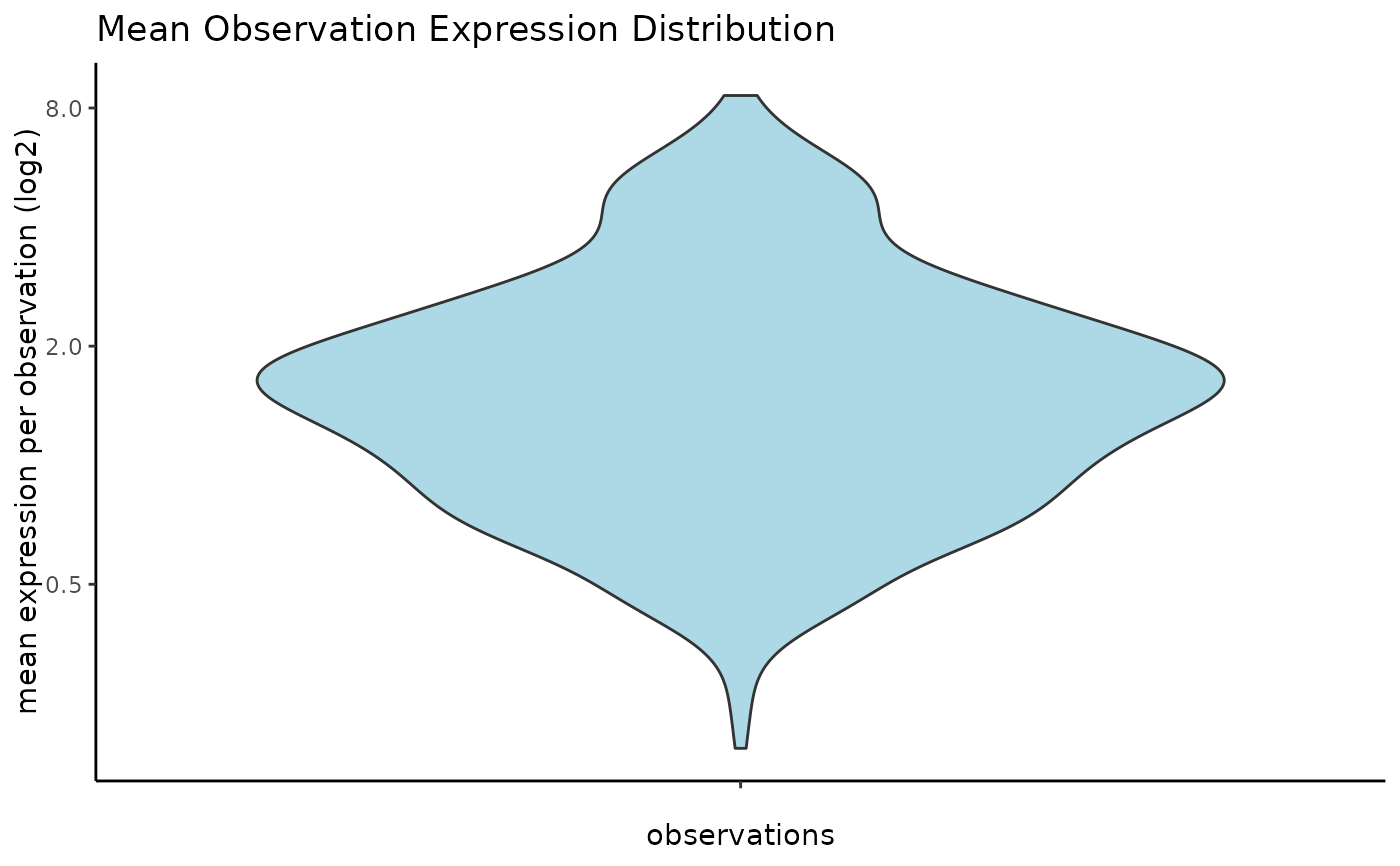
 # visualize mean expression per cell
filterDistributions(g,
detection = "cell",
plot_type = "violin",
method = "mean",
scale_axis = "log2"
)
# visualize mean expression per cell
filterDistributions(g,
detection = "cell",
plot_type = "violin",
method = "mean",
scale_axis = "log2"
)