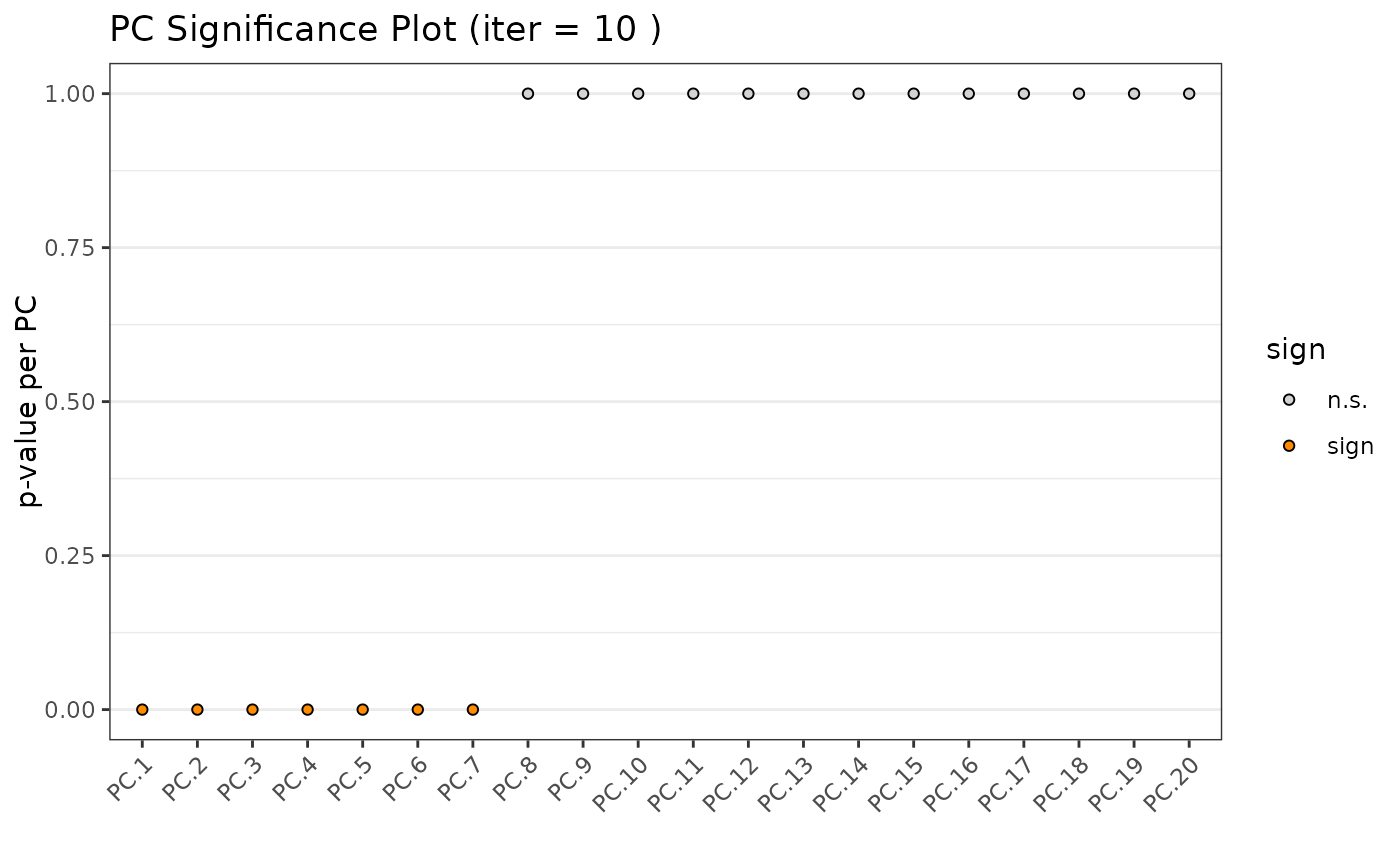
Identify significant principal components (PCs)
jackstrawPlot(
  gobject,
  spat_unit = NULL,
  feat_type = NULL,
  expression_values = c("normalized", "scaled", "custom"),
  reduction = c("cells", "feats"),
  feats_to_use = "hvf",
  center = TRUE,
  scale_unit = TRUE,
  ncp = 20,
  ylim = c(0, 1),
  iter = 10,
  threshold = 0.01,
  random_subset = NULL,
  set_seed = TRUE,
  seed_number = 1234,
  verbose = TRUE,
  show_plot = NULL,
  return_plot = NULL,
  save_plot = NULL,
  save_param = list(),
  default_save_name = "jackstrawPlot"
)
Arguments
- gobject
giotto object
- spat_unit
spatial unit (e.g. "cell")
- feat_type
feature type (e.g. "rna", "dna", "protein")
- expression_values
expression values to use
- reduction
cells or genes
- feats_to_use
subset of features to use for PCA
- center
center data before PCA
- scale_unit
scale features before PCA
- ncp
number of principal components to calculate
- ylim
y-axis limits on jackstraw plot
- iter
number of iterations for jackstraw
- threshold
p-value threshold to call a PC significant
- random_subset
randomized subset of matrix to use to approximate but speed up calculation
- set_seed
logical. whether to set a seed when random_subset is used
- seed_number
seed number to use when random_subset is used
- verbose
show progress of jackstraw method
- show_plot
logical. show plot
- return_plot
logical. return ggplot object
- save_plot
logical. save the plot
- save_param
list of saving parameters, see
showSaveParameters- default_save_name
default save name for saving, don't change, change save_name in save_param
Value
if return_plot = TRUE: ggplot object for jackstraw method
if return_plot = FALSE: silently returns number of significant PCs
Details
The Jackstraw method uses the permutationPA
function. By systematically permuting genes it identifies robust, and thus
significant, PCs. This implementation makes small modifications to SVD
calculation for improved efficiency and flexibility with different matrix
types.
This implementation supports both dense and sparse input matrices.
steps
Select singular values to calculate based on matrix dims and ncp
Find SVD to get variance explained of each PC
Randomly sample across features then re-calculate randomized variance
Determine P-value by comparing actual vs randomized explained variance, indicating the significance of each PC
Examples
g <- GiottoData::loadGiottoMini("visium")
#> 1. read Giotto object
#> 2. read Giotto feature information
#> 3. read Giotto spatial information
#> 3.1 read Giotto spatial shape information
#> 3.2 read Giotto spatial centroid information
#> 3.3 read Giotto spatial overlap information
#> 4. read Giotto image information
#> python already initialized in this session
#>  active environment : '/usr/bin/python3'
#>  python version : 3.12

jackstrawPlot(gobject = g)
#> using 'jackstraw' to identify significant PCs If used in
#>   published research, please cite:
#>   Neo Christopher Chung and John D. Storey (2014).
#>   'Statistical significance of variables driving systematic variation in
#>   high-dimensional data. Bioinformatics
#> "hvf" column was found in the feats metadata information and will be
#>  used to select highly variable features
#> Estimating number of significant principal components:
#>
#> number of estimated significant components: 7
