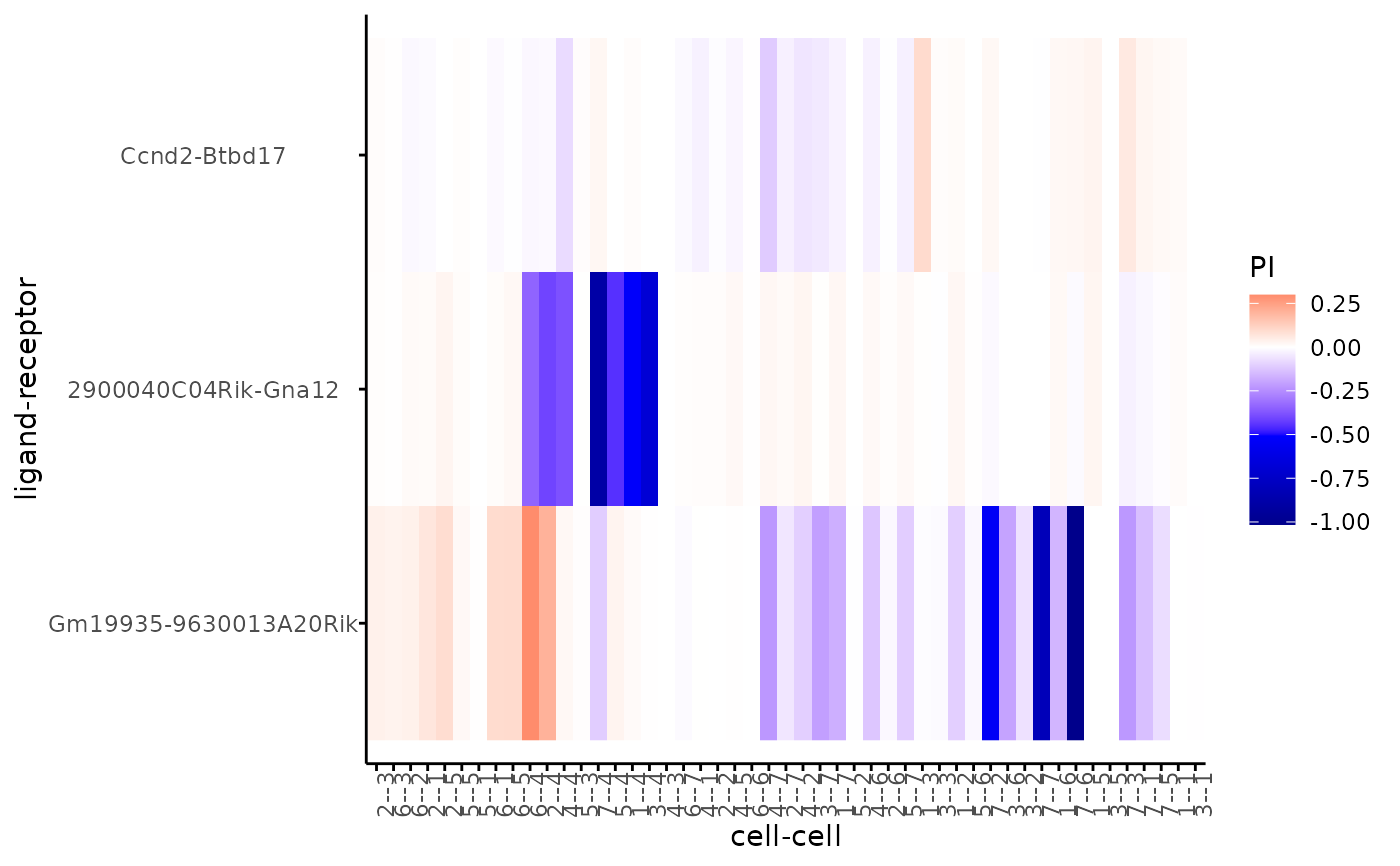
Plots heatmap for ligand-receptor communication scores in cell-cell interactions
plotCCcomHeatmap(
  gobject,
  comScores,
  selected_LR = NULL,
  selected_cell_LR = NULL,
  show_LR_names = TRUE,
  show_cell_LR_names = TRUE,
  show = c("PI", "LR_expr", "log2fc"),
  cor_method = c("pearson", "kendall", "spearman"),
  aggl_method = c("ward.D", "ward.D2", "single", "complete", "average", "mcquitty",
    "median", "centroid"),
  gradient_color = NULL,
  gradient_style = c("divergent", "sequential"),
  show_plot = NULL,
  return_plot = NULL,
  save_plot = NULL,
  save_param = list(),
  default_save_name = "plotCCcomHeatmap"
)
Arguments
- gobject
giotto object
- comScores
communinication scores from
exprCellCellcomorspatCellCellcom- selected_LR
selected ligand-receptor combinations
- selected_cell_LR
selected cell-cell combinations for ligand-receptor combinations
- show_LR_names
show ligand-receptor names
- show_cell_LR_names
show cell-cell names
- show
values to show on heatmap
- cor_method
correlation method used for clustering
- aggl_method
agglomeration method used by hclust
- gradient_color
character. continuous colors to use. palette to use or vector of colors to use (minimum of 2).
- gradient_style
either 'divergent' (midpoint is used in color scaling) or 'sequential' (scaled based on data range)
- show_plot
logical. show plot
- return_plot
logical. return ggplot object
- save_plot
logical. save the plot
- save_param
list of saving parameters, see
showSaveParameters- default_save_name
default save name for saving, don't change, change save_name in save_param
Value
ggplot
Examples
g <- GiottoData::loadGiottoMini("visium")
#> 1. read Giotto object
#> 2. read Giotto feature information
#> 3. read Giotto spatial information
#> 3.1 read Giotto spatial shape information
#> 3.2 read Giotto spatial centroid information
#> 3.3 read Giotto spatial overlap information
#> 4. read Giotto image information
#> python already initialized in this session
#>  active environment : '/usr/bin/python3'
#>  python version : 3.12

comScores <- exprCellCellcom(g,
    cluster_column = "leiden_clus",
    feat_set_1 = c("Gm19935", "2900040C04Rik", "Ccnd2"),
    feat_set_2 = c("9630013A20Rik", "Gna12", "Btbd17")
)

plotCCcomHeatmap(gobject = g, comScores = comScores, show_plot = TRUE)
